Scotch-Irish vs Potawatomi Disability
COMPARE
Scotch-Irish
Potawatomi
Disability
Disability Comparison
Scotch-Irish
Potawatomi
13.3%
DISABILITY
0.0/ 100
METRIC RATING
303rd/ 347
METRIC RANK
14.2%
DISABILITY
0.0/ 100
METRIC RATING
329th/ 347
METRIC RANK
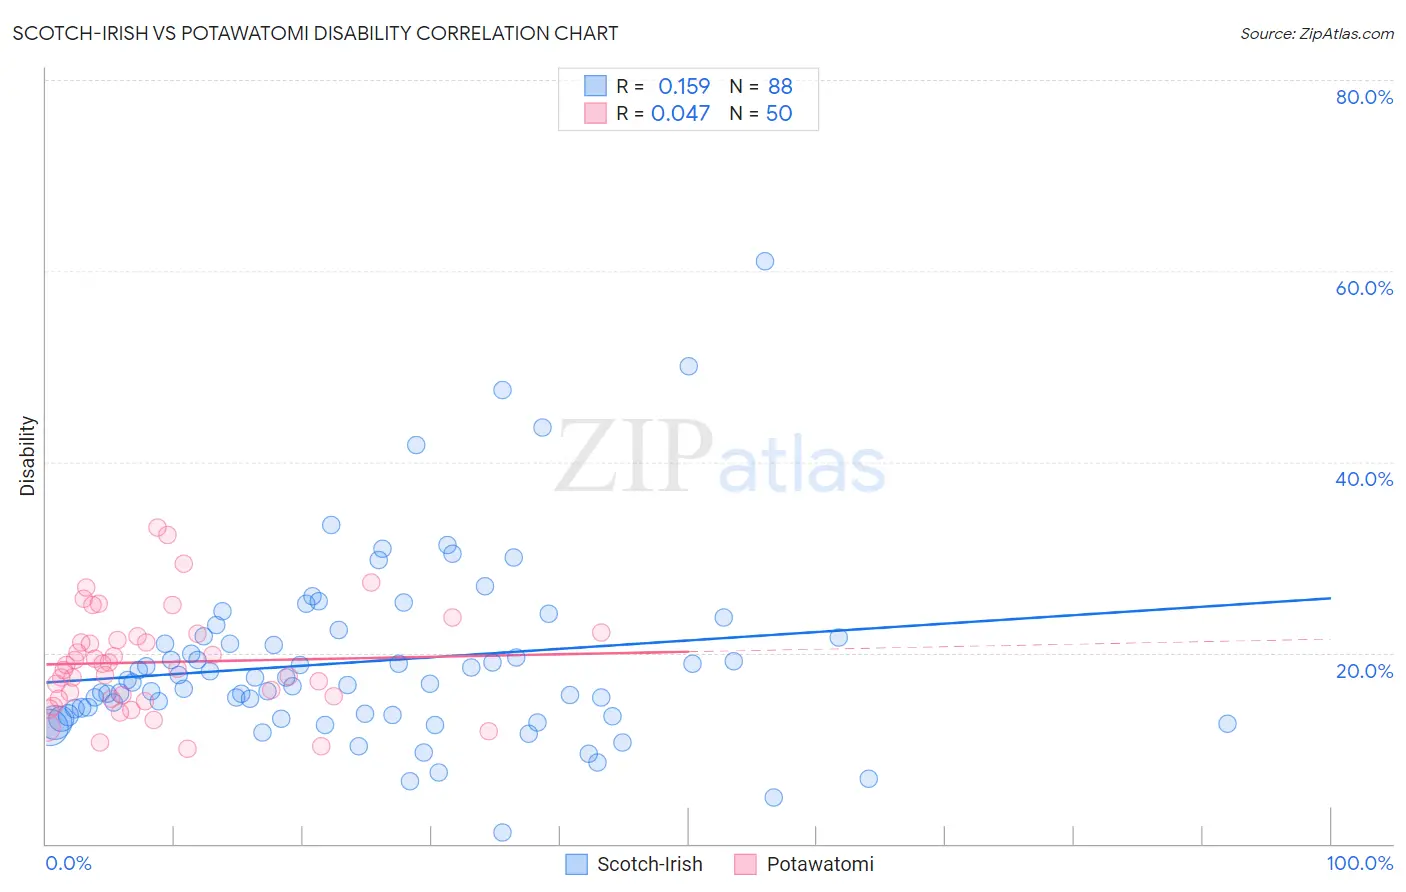
Scotch-Irish vs Potawatomi Disability Correlation Chart
The statistical analysis conducted on geographies consisting of 548,670,555 people shows a poor positive correlation between the proportion of Scotch-Irish and percentage of population with a disability in the United States with a correlation coefficient (R) of 0.159 and weighted average of 13.3%. Similarly, the statistical analysis conducted on geographies consisting of 117,767,457 people shows no correlation between the proportion of Potawatomi and percentage of population with a disability in the United States with a correlation coefficient (R) of 0.047 and weighted average of 14.2%, a difference of 6.5%.
Disability Correlation Summary
| Measurement | Scotch-Irish | Potawatomi |
| Minimum | 1.2% | 9.9% |
| Maximum | 61.0% | 33.1% |
| Range | 59.8% | 23.2% |
| Mean | 19.1% | 19.0% |
| Median | 16.8% | 18.5% |
| Interquartile 25% (IQ1) | 13.5% | 15.2% |
| Interquartile 75% (IQ3) | 21.7% | 21.7% |
| Interquartile Range (IQR) | 8.2% | 6.5% |
| Standard Deviation (Sample) | 9.6% | 5.4% |
| Standard Deviation (Population) | 9.6% | 5.3% |
Similar Demographics by Disability
Demographics Similar to Scotch-Irish by Disability
In terms of disability, the demographic groups most similar to Scotch-Irish are Yakama (13.4%, a difference of 0.47%), Arapaho (13.2%, a difference of 0.78%), French Canadian (13.4%, a difference of 0.81%), Immigrants from Micronesia (13.2%, a difference of 0.99%), and Pennsylvania German (13.2%, a difference of 1.1%).
| Demographics | Rating | Rank | Disability |
| Central American Indians | 0.0 /100 | #296 | Tragic 13.2% |
| Hopi | 0.0 /100 | #297 | Tragic 13.2% |
| Alaska Natives | 0.0 /100 | #298 | Tragic 13.2% |
| French | 0.0 /100 | #299 | Tragic 13.2% |
| Pennsylvania Germans | 0.0 /100 | #300 | Tragic 13.2% |
| Immigrants | Micronesia | 0.0 /100 | #301 | Tragic 13.2% |
| Arapaho | 0.0 /100 | #302 | Tragic 13.2% |
| Scotch-Irish | 0.0 /100 | #303 | Tragic 13.3% |
| Yakama | 0.0 /100 | #304 | Tragic 13.4% |
| French Canadians | 0.0 /100 | #305 | Tragic 13.4% |
| Cape Verdeans | 0.0 /100 | #306 | Tragic 13.5% |
| Shoshone | 0.0 /100 | #307 | Tragic 13.5% |
| French American Indians | 0.0 /100 | #308 | Tragic 13.5% |
| Tlingit-Haida | 0.0 /100 | #309 | Tragic 13.5% |
| Blackfeet | 0.0 /100 | #310 | Tragic 13.6% |
Demographics Similar to Potawatomi by Disability
In terms of disability, the demographic groups most similar to Potawatomi are Ottawa (14.2%, a difference of 0.12%), Immigrants from the Azores (14.2%, a difference of 0.12%), Osage (14.2%, a difference of 0.14%), Native/Alaskan (14.2%, a difference of 0.17%), and Chippewa (14.1%, a difference of 0.22%).
| Demographics | Rating | Rank | Disability |
| Americans | 0.0 /100 | #322 | Tragic 13.9% |
| Comanche | 0.0 /100 | #323 | Tragic 14.1% |
| Chippewa | 0.0 /100 | #324 | Tragic 14.1% |
| Natives/Alaskans | 0.0 /100 | #325 | Tragic 14.2% |
| Osage | 0.0 /100 | #326 | Tragic 14.2% |
| Ottawa | 0.0 /100 | #327 | Tragic 14.2% |
| Immigrants | Azores | 0.0 /100 | #328 | Tragic 14.2% |
| Potawatomi | 0.0 /100 | #329 | Tragic 14.2% |
| Navajo | 0.0 /100 | #330 | Tragic 14.3% |
| Alaskan Athabascans | 0.0 /100 | #331 | Tragic 14.4% |
| Pueblo | 0.0 /100 | #332 | Tragic 14.4% |
| Cajuns | 0.0 /100 | #333 | Tragic 14.6% |
| Yuman | 0.0 /100 | #334 | Tragic 14.6% |
| Tohono O'odham | 0.0 /100 | #335 | Tragic 14.8% |
| Cherokee | 0.0 /100 | #336 | Tragic 14.8% |