Scotch-Irish vs Korean Disability Age 65 to 74
COMPARE
Scotch-Irish
Korean
Disability Age 65 to 74
Disability Age 65 to 74 Comparison
Scotch-Irish
Koreans
24.4%
DISABILITY AGE 65 TO 74
3.8/ 100
METRIC RATING
235th/ 347
METRIC RANK
23.1%
DISABILITY AGE 65 TO 74
64.2/ 100
METRIC RATING
160th/ 347
METRIC RANK
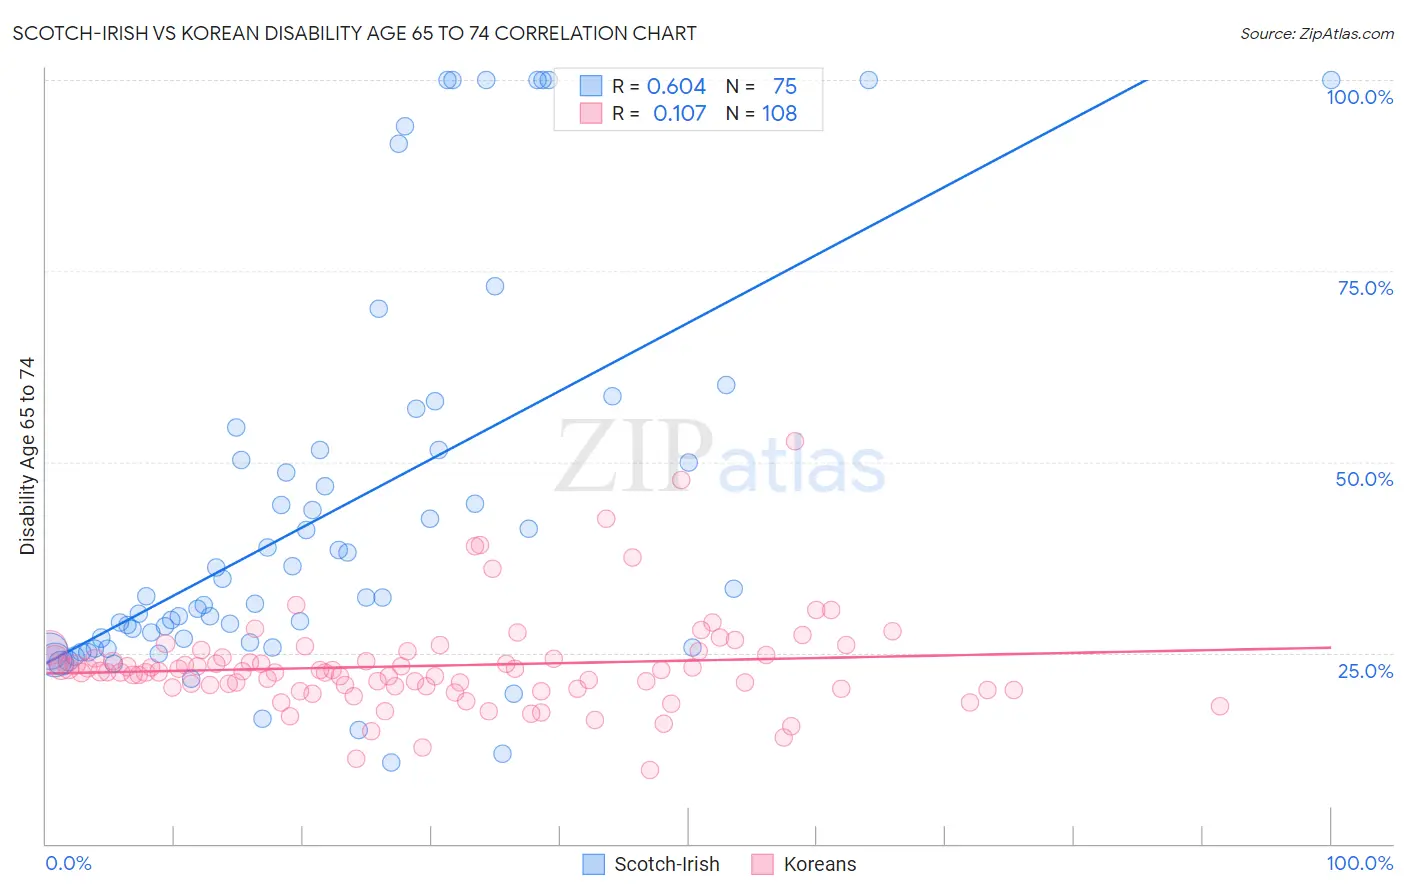
Scotch-Irish vs Korean Disability Age 65 to 74 Correlation Chart
The statistical analysis conducted on geographies consisting of 546,992,221 people shows a significant positive correlation between the proportion of Scotch-Irish and percentage of population with a disability between the ages 65 and 75 in the United States with a correlation coefficient (R) of 0.604 and weighted average of 24.4%. Similarly, the statistical analysis conducted on geographies consisting of 509,278,408 people shows a poor positive correlation between the proportion of Koreans and percentage of population with a disability between the ages 65 and 75 in the United States with a correlation coefficient (R) of 0.107 and weighted average of 23.1%, a difference of 5.6%.
Disability Age 65 to 74 Correlation Summary
| Measurement | Scotch-Irish | Korean |
| Minimum | 10.7% | 9.7% |
| Maximum | 100.0% | 52.7% |
| Range | 89.3% | 43.0% |
| Mean | 43.1% | 23.3% |
| Median | 32.3% | 22.5% |
| Interquartile 25% (IQ1) | 25.8% | 20.4% |
| Interquartile 75% (IQ3) | 51.5% | 24.5% |
| Interquartile Range (IQR) | 25.7% | 4.1% |
| Standard Deviation (Sample) | 25.2% | 6.4% |
| Standard Deviation (Population) | 25.0% | 6.4% |
Similar Demographics by Disability Age 65 to 74
Demographics Similar to Scotch-Irish by Disability Age 65 to 74
In terms of disability age 65 to 74, the demographic groups most similar to Scotch-Irish are German Russian (24.4%, a difference of 0.040%), West Indian (24.5%, a difference of 0.14%), Panamanian (24.4%, a difference of 0.16%), Bahamian (24.4%, a difference of 0.26%), and Immigrants from Ghana (24.5%, a difference of 0.31%).
| Demographics | Rating | Rank | Disability Age 65 to 74 |
| Whites/Caucasians | 6.6 /100 | #228 | Tragic 24.2% |
| Celtics | 6.4 /100 | #229 | Tragic 24.2% |
| Barbadians | 6.0 /100 | #230 | Tragic 24.3% |
| Immigrants | Thailand | 5.2 /100 | #231 | Tragic 24.3% |
| Immigrants | Zaire | 5.0 /100 | #232 | Tragic 24.3% |
| Bahamians | 4.5 /100 | #233 | Tragic 24.4% |
| Panamanians | 4.2 /100 | #234 | Tragic 24.4% |
| Scotch-Irish | 3.8 /100 | #235 | Tragic 24.4% |
| German Russians | 3.7 /100 | #236 | Tragic 24.4% |
| West Indians | 3.4 /100 | #237 | Tragic 24.5% |
| Immigrants | Ghana | 3.0 /100 | #238 | Tragic 24.5% |
| Immigrants | Caribbean | 2.6 /100 | #239 | Tragic 24.6% |
| Spaniards | 2.4 /100 | #240 | Tragic 24.6% |
| Immigrants | Western Africa | 2.3 /100 | #241 | Tragic 24.6% |
| Immigrants | Senegal | 2.2 /100 | #242 | Tragic 24.6% |
Demographics Similar to Koreans by Disability Age 65 to 74
In terms of disability age 65 to 74, the demographic groups most similar to Koreans are Immigrants from Cameroon (23.1%, a difference of 0.030%), South American Indian (23.1%, a difference of 0.090%), European (23.2%, a difference of 0.18%), Immigrants from Philippines (23.2%, a difference of 0.19%), and Sierra Leonean (23.2%, a difference of 0.20%).
| Demographics | Rating | Rank | Disability Age 65 to 74 |
| Slavs | 75.2 /100 | #153 | Good 23.0% |
| Sri Lankans | 74.0 /100 | #154 | Good 23.0% |
| British | 73.9 /100 | #155 | Good 23.0% |
| Immigrants | Western Asia | 73.8 /100 | #156 | Good 23.0% |
| Czechoslovakians | 72.4 /100 | #157 | Good 23.0% |
| Immigrants | Vietnam | 69.1 /100 | #158 | Good 23.1% |
| South American Indians | 65.5 /100 | #159 | Good 23.1% |
| Koreans | 64.2 /100 | #160 | Good 23.1% |
| Immigrants | Cameroon | 63.8 /100 | #161 | Good 23.1% |
| Europeans | 61.2 /100 | #162 | Good 23.2% |
| Immigrants | Philippines | 61.1 /100 | #163 | Good 23.2% |
| Sierra Leoneans | 60.9 /100 | #164 | Good 23.2% |
| Vietnamese | 60.8 /100 | #165 | Good 23.2% |
| Immigrants | Afghanistan | 60.5 /100 | #166 | Good 23.2% |
| Immigrants | Bosnia and Herzegovina | 57.6 /100 | #167 | Average 23.2% |