Scotch-Irish vs Belizean Disability Age Over 75
COMPARE
Scotch-Irish
Belizean
Disability Age Over 75
Disability Age Over 75 Comparison
Scotch-Irish
Belizeans
47.3%
DISABILITY AGE OVER 75
52.5/ 100
METRIC RATING
172nd/ 347
METRIC RANK
49.4%
DISABILITY AGE OVER 75
0.0/ 100
METRIC RATING
281st/ 347
METRIC RANK
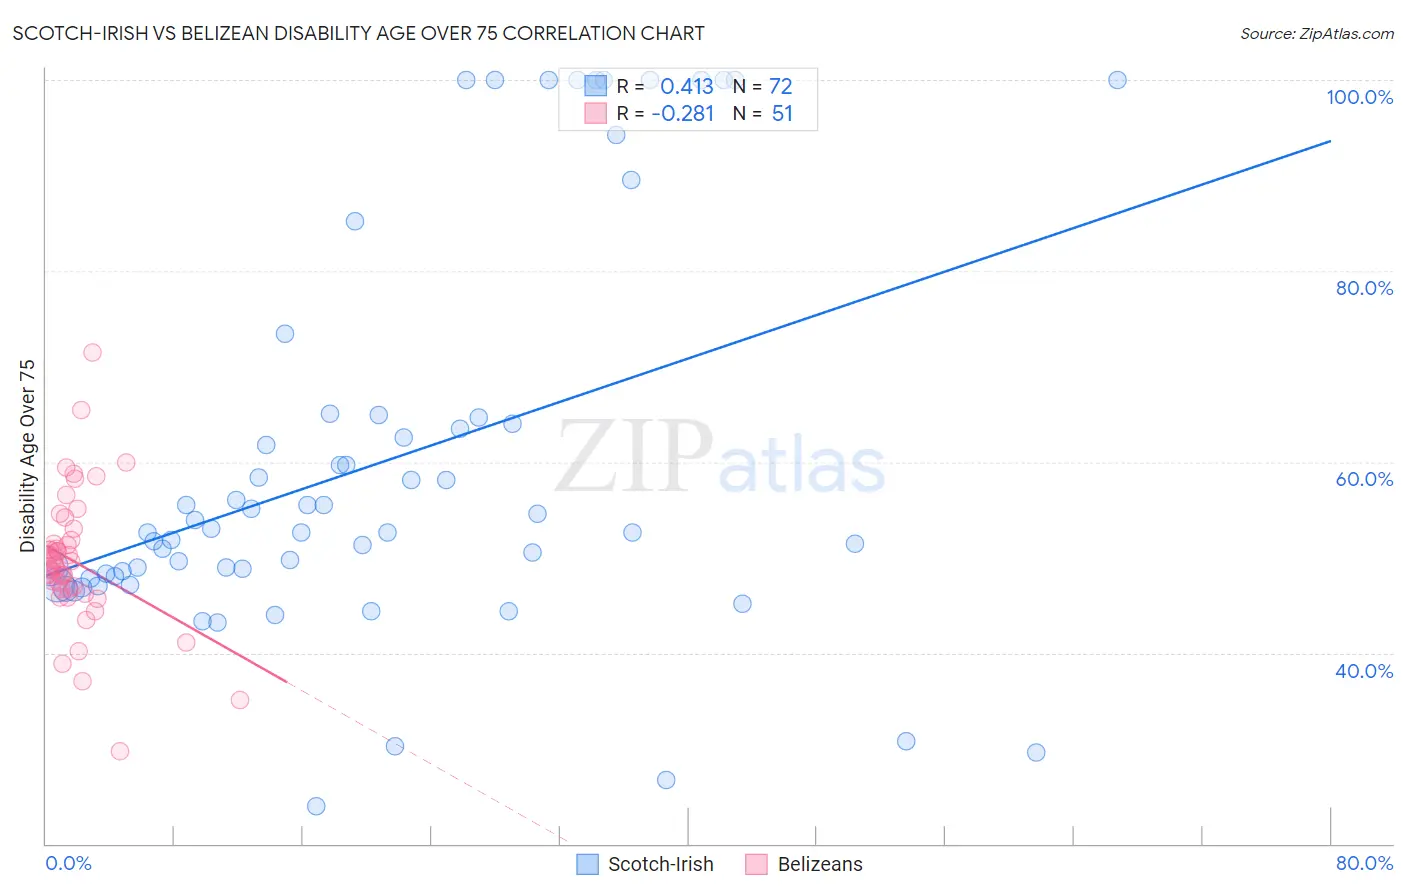
Scotch-Irish vs Belizean Disability Age Over 75 Correlation Chart
The statistical analysis conducted on geographies consisting of 547,171,445 people shows a moderate positive correlation between the proportion of Scotch-Irish and percentage of population with a disability over the age of 75 in the United States with a correlation coefficient (R) of 0.413 and weighted average of 47.3%. Similarly, the statistical analysis conducted on geographies consisting of 144,100,145 people shows a weak negative correlation between the proportion of Belizeans and percentage of population with a disability over the age of 75 in the United States with a correlation coefficient (R) of -0.281 and weighted average of 49.4%, a difference of 4.5%.
Disability Age Over 75 Correlation Summary
| Measurement | Scotch-Irish | Belizean |
| Minimum | 24.0% | 29.7% |
| Maximum | 100.0% | 71.4% |
| Range | 76.0% | 41.7% |
| Mean | 59.9% | 49.6% |
| Median | 52.7% | 49.1% |
| Interquartile 25% (IQ1) | 47.9% | 46.7% |
| Interquartile 75% (IQ3) | 64.4% | 51.8% |
| Interquartile Range (IQR) | 16.4% | 5.1% |
| Standard Deviation (Sample) | 20.7% | 7.1% |
| Standard Deviation (Population) | 20.5% | 7.0% |
Similar Demographics by Disability Age Over 75
Demographics Similar to Scotch-Irish by Disability Age Over 75
In terms of disability age over 75, the demographic groups most similar to Scotch-Irish are Alsatian (47.3%, a difference of 0.010%), Immigrants from Africa (47.3%, a difference of 0.030%), White/Caucasian (47.3%, a difference of 0.060%), Immigrants from Haiti (47.3%, a difference of 0.060%), and German Russian (47.3%, a difference of 0.080%).
| Demographics | Rating | Rank | Disability Age Over 75 |
| Immigrants | Zimbabwe | 64.4 /100 | #165 | Good 47.2% |
| Immigrants | Sierra Leone | 64.4 /100 | #166 | Good 47.2% |
| Moroccans | 62.9 /100 | #167 | Good 47.2% |
| Kenyans | 58.8 /100 | #168 | Average 47.2% |
| Celtics | 58.7 /100 | #169 | Average 47.2% |
| German Russians | 56.2 /100 | #170 | Average 47.3% |
| Immigrants | Africa | 53.6 /100 | #171 | Average 47.3% |
| Scotch-Irish | 52.5 /100 | #172 | Average 47.3% |
| Alsatians | 51.9 /100 | #173 | Average 47.3% |
| Whites/Caucasians | 50.0 /100 | #174 | Average 47.3% |
| Immigrants | Haiti | 49.7 /100 | #175 | Average 47.3% |
| Ecuadorians | 46.7 /100 | #176 | Average 47.4% |
| Haitians | 44.6 /100 | #177 | Average 47.4% |
| Cubans | 42.1 /100 | #178 | Average 47.4% |
| Sierra Leoneans | 41.7 /100 | #179 | Average 47.4% |
Demographics Similar to Belizeans by Disability Age Over 75
In terms of disability age over 75, the demographic groups most similar to Belizeans are Bangladeshi (49.4%, a difference of 0.0%), Guamanian/Chamorro (49.4%, a difference of 0.070%), Black/African American (49.5%, a difference of 0.14%), Samoan (49.5%, a difference of 0.17%), and Immigrants from Latin America (49.5%, a difference of 0.22%).
| Demographics | Rating | Rank | Disability Age Over 75 |
| Immigrants | Guatemala | 0.1 /100 | #274 | Tragic 49.1% |
| Immigrants | Dominica | 0.1 /100 | #275 | Tragic 49.1% |
| Immigrants | Uzbekistan | 0.1 /100 | #276 | Tragic 49.2% |
| Hawaiians | 0.1 /100 | #277 | Tragic 49.2% |
| Immigrants | Laos | 0.1 /100 | #278 | Tragic 49.2% |
| Guamanians/Chamorros | 0.0 /100 | #279 | Tragic 49.4% |
| Bangladeshis | 0.0 /100 | #280 | Tragic 49.4% |
| Belizeans | 0.0 /100 | #281 | Tragic 49.4% |
| Blacks/African Americans | 0.0 /100 | #282 | Tragic 49.5% |
| Samoans | 0.0 /100 | #283 | Tragic 49.5% |
| Immigrants | Latin America | 0.0 /100 | #284 | Tragic 49.5% |
| Crow | 0.0 /100 | #285 | Tragic 49.6% |
| Immigrants | Belize | 0.0 /100 | #286 | Tragic 49.6% |
| Sioux | 0.0 /100 | #287 | Tragic 49.7% |
| Yaqui | 0.0 /100 | #288 | Tragic 49.8% |