Samoan vs Immigrants from Albania Hearing Disability
COMPARE
Samoan
Immigrants from Albania
Hearing Disability
Hearing Disability Comparison
Samoans
Immigrants from Albania
3.3%
HEARING DISABILITY
1.1/ 100
METRIC RATING
241st/ 347
METRIC RANK
2.9%
HEARING DISABILITY
88.5/ 100
METRIC RATING
125th/ 347
METRIC RANK
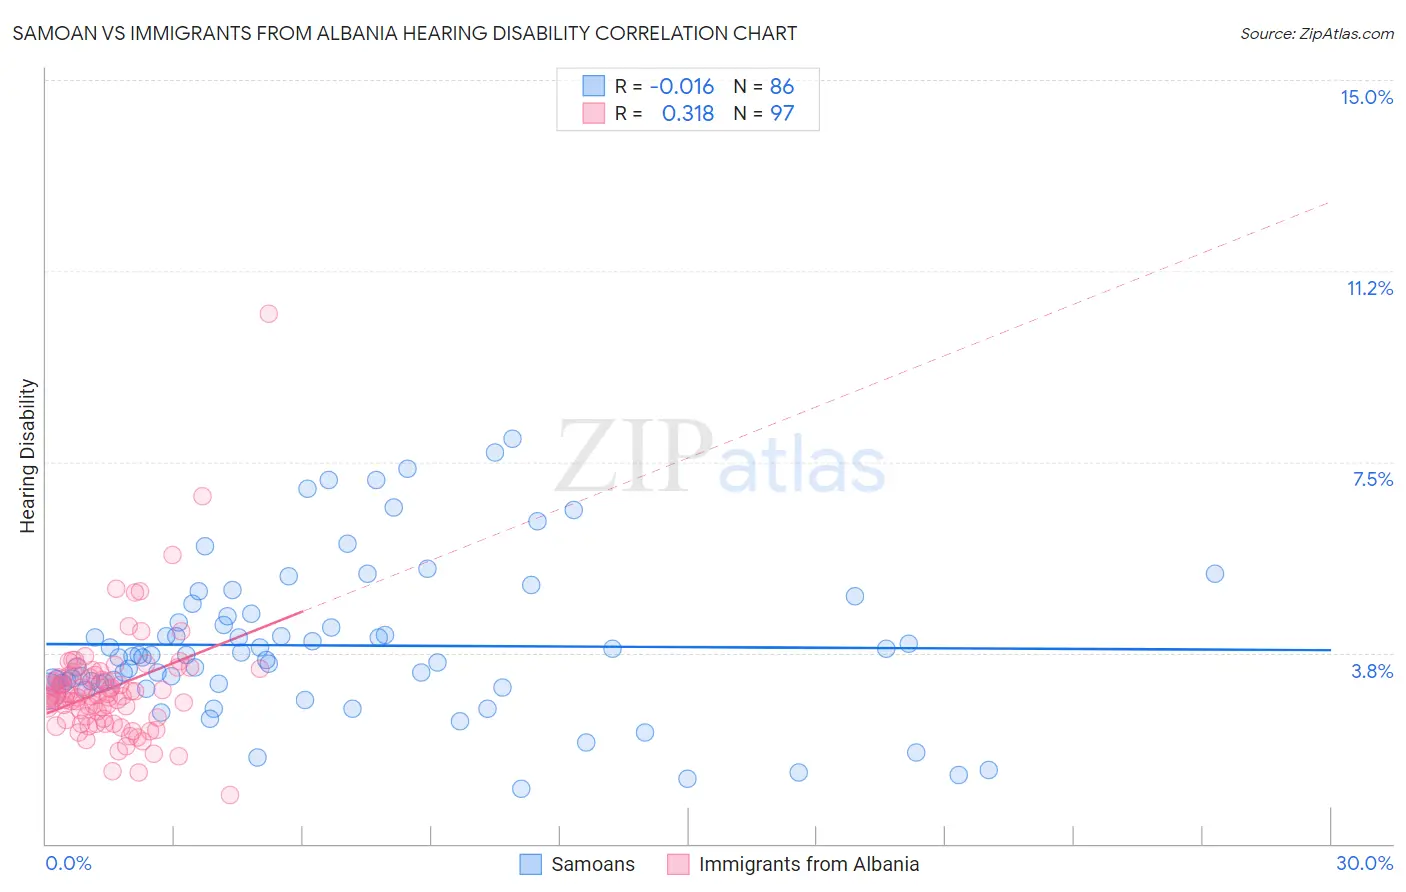
Samoan vs Immigrants from Albania Hearing Disability Correlation Chart
The statistical analysis conducted on geographies consisting of 225,100,241 people shows no correlation between the proportion of Samoans and percentage of population with hearing disability in the United States with a correlation coefficient (R) of -0.016 and weighted average of 3.3%. Similarly, the statistical analysis conducted on geographies consisting of 119,393,957 people shows a mild positive correlation between the proportion of Immigrants from Albania and percentage of population with hearing disability in the United States with a correlation coefficient (R) of 0.318 and weighted average of 2.9%, a difference of 16.2%.
Hearing Disability Correlation Summary
| Measurement | Samoan | Immigrants from Albania |
| Minimum | 1.1% | 0.95% |
| Maximum | 8.0% | 10.4% |
| Range | 6.9% | 9.5% |
| Mean | 3.9% | 3.0% |
| Median | 3.7% | 2.9% |
| Interquartile 25% (IQ1) | 3.1% | 2.5% |
| Interquartile 75% (IQ3) | 4.5% | 3.3% |
| Interquartile Range (IQR) | 1.3% | 0.85% |
| Standard Deviation (Sample) | 1.5% | 1.1% |
| Standard Deviation (Population) | 1.5% | 1.1% |
Similar Demographics by Hearing Disability
Demographics Similar to Samoans by Hearing Disability
In terms of hearing disability, the demographic groups most similar to Samoans are Immigrants from Netherlands (3.3%, a difference of 0.070%), Yugoslavian (3.3%, a difference of 0.11%), Nepalese (3.3%, a difference of 0.25%), Immigrants from Western Europe (3.3%, a difference of 0.28%), and Assyrian/Chaldean/Syriac (3.3%, a difference of 0.35%).
| Demographics | Rating | Rank | Hearing Disability |
| Central American Indians | 2.3 /100 | #234 | Tragic 3.3% |
| Guamanians/Chamorros | 2.2 /100 | #235 | Tragic 3.3% |
| Serbians | 2.2 /100 | #236 | Tragic 3.3% |
| Immigrants | Austria | 1.8 /100 | #237 | Tragic 3.3% |
| German Russians | 1.8 /100 | #238 | Tragic 3.3% |
| Nepalese | 1.2 /100 | #239 | Tragic 3.3% |
| Immigrants | Netherlands | 1.1 /100 | #240 | Tragic 3.3% |
| Samoans | 1.1 /100 | #241 | Tragic 3.3% |
| Yugoslavians | 1.0 /100 | #242 | Tragic 3.3% |
| Immigrants | Western Europe | 1.0 /100 | #243 | Tragic 3.3% |
| Assyrians/Chaldeans/Syriacs | 0.9 /100 | #244 | Tragic 3.3% |
| Immigrants | Scotland | 0.8 /100 | #245 | Tragic 3.3% |
| Immigrants | England | 0.7 /100 | #246 | Tragic 3.3% |
| Lithuanians | 0.6 /100 | #247 | Tragic 3.4% |
| Austrians | 0.6 /100 | #248 | Tragic 3.4% |
Demographics Similar to Immigrants from Albania by Hearing Disability
In terms of hearing disability, the demographic groups most similar to Immigrants from Albania are Immigrants from Zaire (2.9%, a difference of 0.030%), Bahamian (2.9%, a difference of 0.030%), Liberian (2.8%, a difference of 0.13%), Immigrants from Sudan (2.9%, a difference of 0.16%), and Cuban (2.8%, a difference of 0.22%).
| Demographics | Rating | Rank | Hearing Disability |
| Zimbabweans | 89.9 /100 | #118 | Excellent 2.8% |
| Kenyans | 89.8 /100 | #119 | Excellent 2.8% |
| Jordanians | 89.5 /100 | #120 | Excellent 2.8% |
| Cubans | 89.4 /100 | #121 | Excellent 2.8% |
| Liberians | 89.0 /100 | #122 | Excellent 2.8% |
| Immigrants | Zaire | 88.6 /100 | #123 | Excellent 2.9% |
| Bahamians | 88.6 /100 | #124 | Excellent 2.9% |
| Immigrants | Albania | 88.5 /100 | #125 | Excellent 2.9% |
| Immigrants | Sudan | 87.8 /100 | #126 | Excellent 2.9% |
| South American Indians | 86.9 /100 | #127 | Excellent 2.9% |
| Immigrants | Western Asia | 86.9 /100 | #128 | Excellent 2.9% |
| Immigrants | Uganda | 86.6 /100 | #129 | Excellent 2.9% |
| Immigrants | Vietnam | 86.5 /100 | #130 | Excellent 2.9% |
| Immigrants | Kenya | 86.1 /100 | #131 | Excellent 2.9% |
| Chileans | 85.8 /100 | #132 | Excellent 2.9% |