Samoan vs Finnish Vision Disability
COMPARE
Samoan
Finnish
Vision Disability
Vision Disability Comparison
Samoans
Finns
2.2%
VISION DISABILITY
15.7/ 100
METRIC RATING
205th/ 347
METRIC RANK
2.1%
VISION DISABILITY
78.3/ 100
METRIC RATING
148th/ 347
METRIC RANK
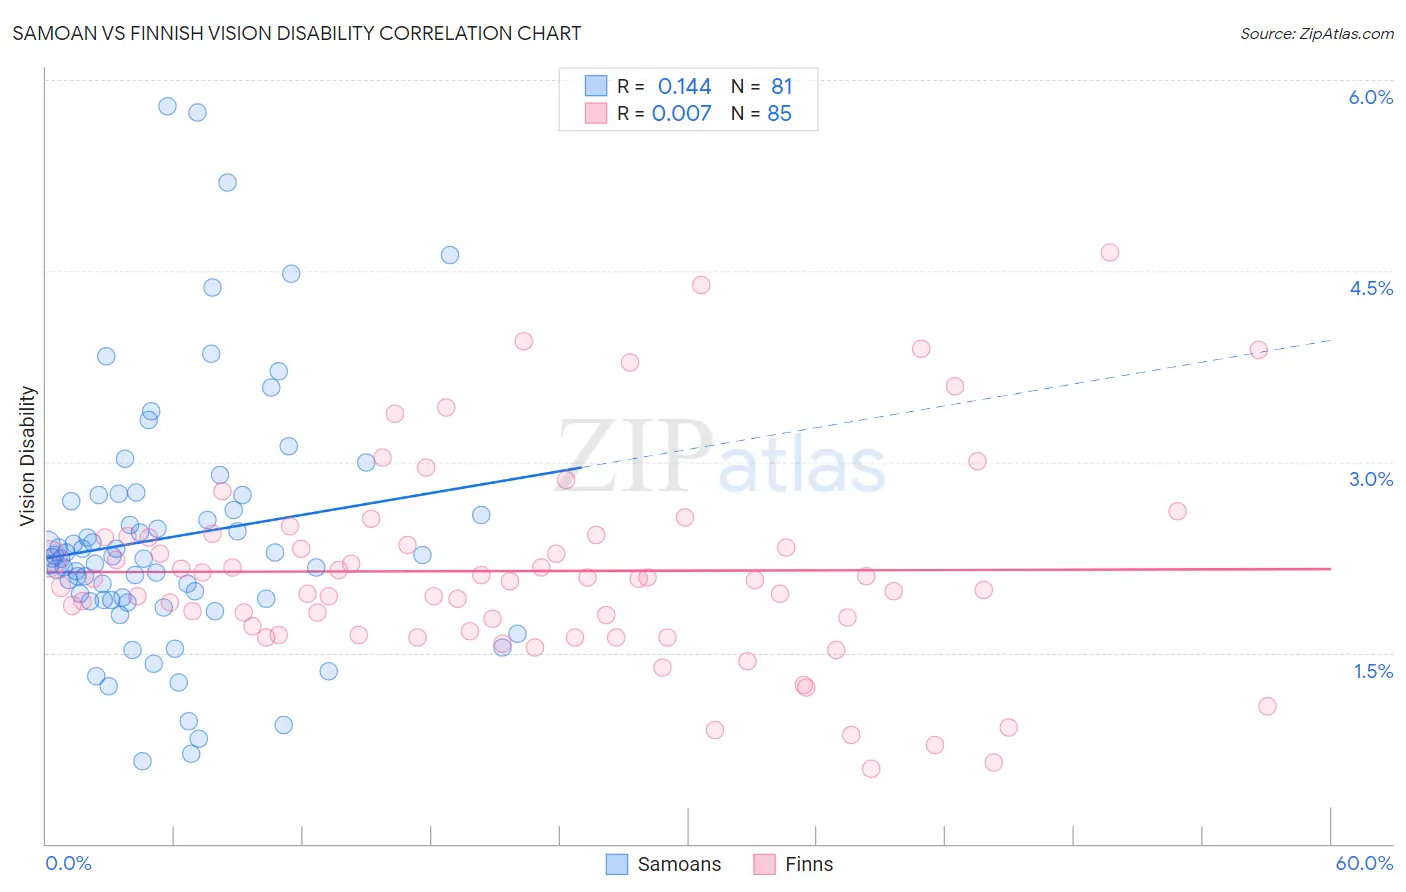
Samoan vs Finnish Vision Disability Correlation Chart
The statistical analysis conducted on geographies consisting of 225,065,967 people shows a poor positive correlation between the proportion of Samoans and percentage of population with vision disability in the United States with a correlation coefficient (R) of 0.144 and weighted average of 2.2%. Similarly, the statistical analysis conducted on geographies consisting of 404,250,677 people shows no correlation between the proportion of Finns and percentage of population with vision disability in the United States with a correlation coefficient (R) of 0.007 and weighted average of 2.1%, a difference of 4.8%.
Vision Disability Correlation Summary
| Measurement | Samoan | Finnish |
| Minimum | 0.64% | 0.59% |
| Maximum | 5.8% | 4.6% |
| Range | 5.1% | 4.0% |
| Mean | 2.4% | 2.1% |
| Median | 2.2% | 2.1% |
| Interquartile 25% (IQ1) | 1.9% | 1.7% |
| Interquartile 75% (IQ3) | 2.7% | 2.4% |
| Interquartile Range (IQR) | 0.80% | 0.76% |
| Standard Deviation (Sample) | 1.0% | 0.79% |
| Standard Deviation (Population) | 1.00% | 0.79% |
Similar Demographics by Vision Disability
Demographics Similar to Samoans by Vision Disability
In terms of vision disability, the demographic groups most similar to Samoans are Immigrants from Guyana (2.2%, a difference of 0.030%), Pennsylvania German (2.2%, a difference of 0.14%), Dutch (2.2%, a difference of 0.16%), Immigrants from Zaire (2.2%, a difference of 0.25%), and Immigrants from Nigeria (2.2%, a difference of 0.27%).
| Demographics | Rating | Rank | Vision Disability |
| Czechoslovakians | 21.6 /100 | #198 | Fair 2.2% |
| Immigrants | El Salvador | 21.0 /100 | #199 | Fair 2.2% |
| Immigrants | Thailand | 20.1 /100 | #200 | Fair 2.2% |
| Slovaks | 18.8 /100 | #201 | Poor 2.2% |
| Immigrants | Zaire | 18.0 /100 | #202 | Poor 2.2% |
| Dutch | 17.1 /100 | #203 | Poor 2.2% |
| Immigrants | Guyana | 15.9 /100 | #204 | Poor 2.2% |
| Samoans | 15.7 /100 | #205 | Poor 2.2% |
| Pennsylvania Germans | 14.5 /100 | #206 | Poor 2.2% |
| Immigrants | Nigeria | 13.5 /100 | #207 | Poor 2.2% |
| Germans | 13.4 /100 | #208 | Poor 2.2% |
| Immigrants | Brazil | 13.1 /100 | #209 | Poor 2.2% |
| Immigrants | Uruguay | 11.5 /100 | #210 | Poor 2.2% |
| Indonesians | 9.5 /100 | #211 | Tragic 2.2% |
| Bermudans | 9.0 /100 | #212 | Tragic 2.2% |
Demographics Similar to Finns by Vision Disability
In terms of vision disability, the demographic groups most similar to Finns are Immigrants from Sudan (2.1%, a difference of 0.010%), Italian (2.1%, a difference of 0.14%), Colombian (2.1%, a difference of 0.19%), Belgian (2.1%, a difference of 0.22%), and Immigrants from Norway (2.1%, a difference of 0.25%).
| Demographics | Rating | Rank | Vision Disability |
| Sierra Leoneans | 84.1 /100 | #141 | Excellent 2.1% |
| South Americans | 82.8 /100 | #142 | Excellent 2.1% |
| Immigrants | Sierra Leone | 82.8 /100 | #143 | Excellent 2.1% |
| Ukrainians | 81.9 /100 | #144 | Excellent 2.1% |
| Immigrants | Bosnia and Herzegovina | 81.5 /100 | #145 | Excellent 2.1% |
| Italians | 79.7 /100 | #146 | Good 2.1% |
| Immigrants | Sudan | 78.4 /100 | #147 | Good 2.1% |
| Finns | 78.3 /100 | #148 | Good 2.1% |
| Colombians | 76.2 /100 | #149 | Good 2.1% |
| Belgians | 75.9 /100 | #150 | Good 2.1% |
| Immigrants | Norway | 75.5 /100 | #151 | Good 2.1% |
| Immigrants | Southern Europe | 74.6 /100 | #152 | Good 2.1% |
| Immigrants | South America | 73.8 /100 | #153 | Good 2.1% |
| Slovenes | 73.6 /100 | #154 | Good 2.1% |
| Immigrants | Colombia | 72.1 /100 | #155 | Good 2.1% |