Salvadoran vs Immigrants from Australia Hearing Disability
COMPARE
Salvadoran
Immigrants from Australia
Hearing Disability
Hearing Disability Comparison
Salvadorans
Immigrants from Australia
2.6%
HEARING DISABILITY
99.6/ 100
METRIC RATING
35th/ 347
METRIC RANK
2.9%
HEARING DISABILITY
67.4/ 100
METRIC RATING
159th/ 347
METRIC RANK
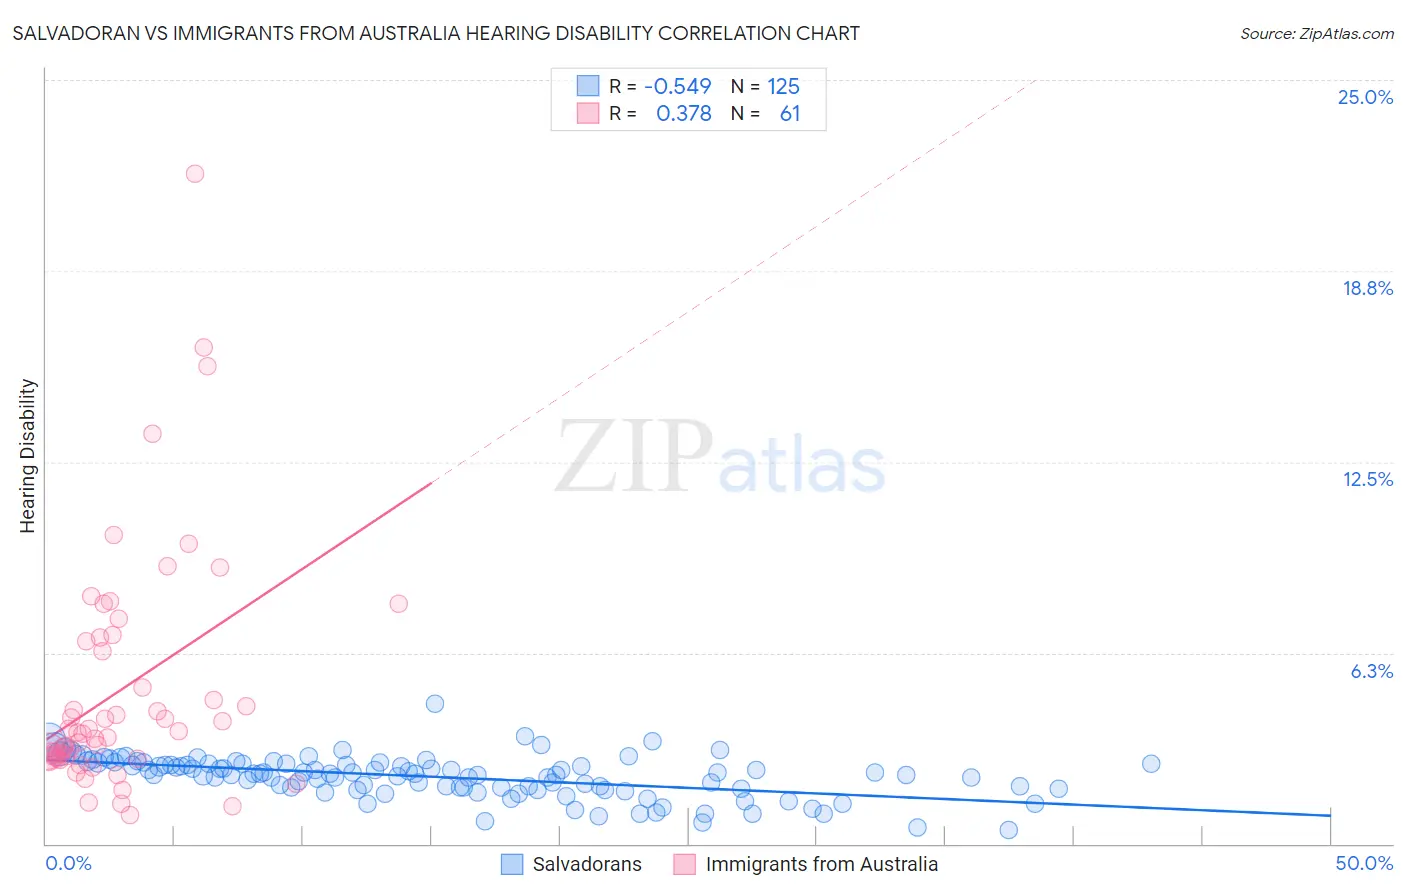
Salvadoran vs Immigrants from Australia Hearing Disability Correlation Chart
The statistical analysis conducted on geographies consisting of 398,804,647 people shows a substantial negative correlation between the proportion of Salvadorans and percentage of population with hearing disability in the United States with a correlation coefficient (R) of -0.549 and weighted average of 2.6%. Similarly, the statistical analysis conducted on geographies consisting of 227,168,365 people shows a mild positive correlation between the proportion of Immigrants from Australia and percentage of population with hearing disability in the United States with a correlation coefficient (R) of 0.378 and weighted average of 2.9%, a difference of 12.9%.
Hearing Disability Correlation Summary
| Measurement | Salvadoran | Immigrants from Australia |
| Minimum | 0.44% | 0.93% |
| Maximum | 4.6% | 21.9% |
| Range | 4.1% | 21.0% |
| Mean | 2.2% | 5.0% |
| Median | 2.3% | 3.6% |
| Interquartile 25% (IQ1) | 1.8% | 2.8% |
| Interquartile 75% (IQ3) | 2.6% | 6.7% |
| Interquartile Range (IQR) | 0.81% | 3.9% |
| Standard Deviation (Sample) | 0.67% | 3.9% |
| Standard Deviation (Population) | 0.67% | 3.9% |
Similar Demographics by Hearing Disability
Demographics Similar to Salvadorans by Hearing Disability
In terms of hearing disability, the demographic groups most similar to Salvadorans are Immigrants from Pakistan (2.6%, a difference of 0.12%), Filipino (2.6%, a difference of 0.16%), Okinawan (2.6%, a difference of 0.22%), Immigrants from Western Africa (2.6%, a difference of 0.25%), and Immigrants from Jamaica (2.6%, a difference of 0.33%).
| Demographics | Rating | Rank | Hearing Disability |
| Immigrants | Haiti | 99.7 /100 | #28 | Exceptional 2.6% |
| Bolivians | 99.7 /100 | #29 | Exceptional 2.6% |
| Immigrants | Caribbean | 99.7 /100 | #30 | Exceptional 2.6% |
| Immigrants | Cameroon | 99.7 /100 | #31 | Exceptional 2.6% |
| Immigrants | Venezuela | 99.7 /100 | #32 | Exceptional 2.6% |
| Filipinos | 99.6 /100 | #33 | Exceptional 2.6% |
| Immigrants | Pakistan | 99.6 /100 | #34 | Exceptional 2.6% |
| Salvadorans | 99.6 /100 | #35 | Exceptional 2.6% |
| Okinawans | 99.6 /100 | #36 | Exceptional 2.6% |
| Immigrants | Western Africa | 99.6 /100 | #37 | Exceptional 2.6% |
| Immigrants | Jamaica | 99.5 /100 | #38 | Exceptional 2.6% |
| Immigrants | China | 99.5 /100 | #39 | Exceptional 2.6% |
| Haitians | 99.5 /100 | #40 | Exceptional 2.6% |
| Immigrants | Taiwan | 99.4 /100 | #41 | Exceptional 2.6% |
| West Indians | 99.4 /100 | #42 | Exceptional 2.6% |
Demographics Similar to Immigrants from Australia by Hearing Disability
In terms of hearing disability, the demographic groups most similar to Immigrants from Australia are Immigrants from Fiji (2.9%, a difference of 0.020%), Albanian (2.9%, a difference of 0.090%), Immigrants from Japan (2.9%, a difference of 0.11%), Immigrants from Burma/Myanmar (2.9%, a difference of 0.23%), and Immigrants from Kazakhstan (2.9%, a difference of 0.25%).
| Demographics | Rating | Rank | Hearing Disability |
| Immigrants | Lithuania | 73.0 /100 | #152 | Good 2.9% |
| Sudanese | 72.1 /100 | #153 | Good 2.9% |
| Immigrants | Lebanon | 71.5 /100 | #154 | Good 2.9% |
| Costa Ricans | 71.4 /100 | #155 | Good 2.9% |
| Immigrants | Poland | 70.2 /100 | #156 | Good 2.9% |
| Immigrants | Kazakhstan | 69.6 /100 | #157 | Good 2.9% |
| Immigrants | Burma/Myanmar | 69.5 /100 | #158 | Good 2.9% |
| Immigrants | Australia | 67.4 /100 | #159 | Good 2.9% |
| Immigrants | Fiji | 67.1 /100 | #160 | Good 2.9% |
| Albanians | 66.6 /100 | #161 | Good 2.9% |
| Immigrants | Japan | 66.3 /100 | #162 | Good 2.9% |
| Immigrants | Central America | 64.9 /100 | #163 | Good 3.0% |
| Immigrants | Cambodia | 64.8 /100 | #164 | Good 3.0% |
| Immigrants | Zimbabwe | 64.2 /100 | #165 | Good 3.0% |
| Immigrants | South Eastern Asia | 62.9 /100 | #166 | Good 3.0% |