Romanian vs Native/Alaskan Disability Age 65 to 74

COMPARE

Romanian
Race
Ancestry
AfghanAfricanAlaska NativeAlaskan AthabascanAlbanianAleutAlsatianAmericanApacheArabArapahoArgentineanArmenianAssyrian/Chaldean/SyriacAustralianAustrianBahamianBangladeshiBarbadianBasqueBelgianBelizeanBermudanBhutaneseBlackfeetBolivianBrazilianBritishBritish West IndianBulgarianBurmeseCajunCambodianCanadianCape VerdeanCarpatho RusynCelticCentral AmericanCentral American IndianCherokeeCheyenneChickasawChileanChineseChippewaChoctawColombianColvilleComancheCosta RicanCreeCreekCroatianCrowCubanCypriotCzechCzechoslovakianDanishDelawareDominicanDutchDutch West IndianEastern EuropeanEcuadorianEgyptianEnglishEstonianEthiopianEuropeanFijianFilipinoFinnishFrenchFrench American IndianFrench CanadianGermanGerman RussianGhanaianGreekGuamanian/ChamorroGuatemalanGuyaneseHaitianHmongHonduranHopiHoumaHungarianIcelanderIndian (Asian)IndonesianInupiatIranianIraqiIrishIroquoisIsraeliItalianJamaicanJapaneseJordanianKenyanKiowaKoreanLaotianLatvianLebaneseLiberianLithuanianLumbeeLuxembourgerMacedonianMalaysianMalteseMarshalleseMenomineeMexicanMexican American IndianMongolianMoroccanNative HawaiianNavajoNepaleseNew ZealanderNicaraguanNigerianNorthern EuropeanNorwegianOkinawanOsageOttawaPaiutePakistaniPalestinianPanamanianParaguayanPennsylvania GermanPeruvianPimaPolishPortuguesePotawatomiPuebloPuerto RicanPuget Sound SalishRomanianRussianSalvadoranSamoanScandinavianScotch-IrishScottishSeminoleSenegaleseSerbianShoshoneSierra LeoneanSiouxSlavicSlovakSloveneSomaliSouth AfricanSouth AmericanSouth American IndianSoviet UnionSpaniardSpanishSpanish AmericanSpanish American IndianSri LankanSubsaharan AfricanSudaneseSwedishSwissSyrianTaiwaneseThaiTlingit-HaidaTohono O'OdhamTonganTrinidadian and TobagonianTsimshianTurkishU.S. Virgin IslanderUgandanUkrainianUruguayanUteVenezuelanVietnameseWelshWest IndianYakamaYaquiYugoslavianYumanYup'ikZimbabwean
Immigration
NonimmigrantsImmigrantsAfghanistanAfricaAlbaniaArgentinaArmeniaAsiaAustraliaAustriaBahamasBangladeshBarbadosBelarusBelgiumBelizeBoliviaBosnia and HerzegovinaBrazilBulgariaBurma/MyanmarCabo VerdeCambodiaCameroonCanadaCaribbeanCentral AmericaChileChinaColombiaCongoCosta RicaCroatiaCubaCzechoslovakiaDenmarkDominicaDominican RepublicEastern AfricaEastern AsiaEastern EuropeEcuadorEgyptEl SalvadorEnglandEritreaEthiopiaEuropeFijiFranceGermanyGhanaGreeceGrenadaGuatemalaGuyanaHaitiHondurasHong KongHungaryIndiaIndonesiaIranIraqIrelandIsraelItalyJamaicaJapanJordanKazakhstanKenyaKoreaKuwaitLaosLatin AmericaLatviaLebanonLiberiaLithuaniaMalaysiaMexicoMicronesiaMiddle AfricaMoldovaMoroccoNepalNetherlandsNicaraguaNigeriaNorth AmericaNorth MacedoniaNorthern AfricaNorthern EuropeNorwayOceaniaPakistanPanamaPeruPhilippinesPolandPortugalRomaniaRussiaSaudi ArabiaScotlandSenegalSerbiaSierra LeoneSingaporeSomaliaSouth AfricaSouth AmericaSouth Central AsiaSouth Eastern AsiaSouthern EuropeSpainSri LankaSt. Vincent and the GrenadinesSudanSwedenSwitzerlandSyriaTaiwanThailandTrinidad and TobagoTurkeyUgandaUkraineUruguayUzbekistanVenezuelaVietnamWest IndiesWestern AfricaWestern AsiaWestern EuropeYemenZaireZimbabweAzores
Native/Alaskan
Race
Ancestry
AfghanAfricanAlaska NativeAlaskan AthabascanAlbanianAleutAlsatianAmericanApacheArabArapahoArgentineanArmenianAssyrian/Chaldean/SyriacAustralianAustrianBahamianBangladeshiBarbadianBasqueBelgianBelizeanBermudanBhutaneseBlackfeetBolivianBrazilianBritishBritish West IndianBulgarianBurmeseCajunCambodianCanadianCape VerdeanCarpatho RusynCelticCentral AmericanCentral American IndianCherokeeCheyenneChickasawChileanChineseChippewaChoctawColombianColvilleComancheCosta RicanCreeCreekCroatianCrowCubanCypriotCzechCzechoslovakianDanishDelawareDominicanDutchDutch West IndianEastern EuropeanEcuadorianEgyptianEnglishEstonianEthiopianEuropeanFijianFilipinoFinnishFrenchFrench American IndianFrench CanadianGermanGerman RussianGhanaianGreekGuamanian/ChamorroGuatemalanGuyaneseHaitianHmongHonduranHopiHoumaHungarianIcelanderIndian (Asian)IndonesianInupiatIranianIraqiIrishIroquoisIsraeliItalianJamaicanJapaneseJordanianKenyanKiowaKoreanLaotianLatvianLebaneseLiberianLithuanianLumbeeLuxembourgerMacedonianMalaysianMalteseMarshalleseMenomineeMexicanMexican American IndianMongolianMoroccanNative HawaiianNavajoNepaleseNew ZealanderNicaraguanNigerianNorthern EuropeanNorwegianOkinawanOsageOttawaPaiutePakistaniPalestinianPanamanianParaguayanPennsylvania GermanPeruvianPimaPolishPortuguesePotawatomiPuebloPuerto RicanPuget Sound SalishRussianSalvadoranSamoanScandinavianScotch-IrishScottishSeminoleSenegaleseSerbianShoshoneSierra LeoneanSiouxSlavicSlovakSloveneSomaliSouth AfricanSouth AmericanSouth American IndianSoviet UnionSpaniardSpanishSpanish AmericanSpanish American IndianSri LankanSubsaharan AfricanSudaneseSwedishSwissSyrianTaiwaneseThaiTlingit-HaidaTohono O'OdhamTonganTrinidadian and TobagonianTsimshianTurkishU.S. Virgin IslanderUgandanUkrainianUruguayanUteVenezuelanVietnameseWelshWest IndianYakamaYaquiYugoslavianYumanYup'ikZimbabwean
Immigration
NonimmigrantsImmigrantsAfghanistanAfricaAlbaniaArgentinaArmeniaAsiaAustraliaAustriaBahamasBangladeshBarbadosBelarusBelgiumBelizeBoliviaBosnia and HerzegovinaBrazilBulgariaBurma/MyanmarCabo VerdeCambodiaCameroonCanadaCaribbeanCentral AmericaChileChinaColombiaCongoCosta RicaCroatiaCubaCzechoslovakiaDenmarkDominicaDominican RepublicEastern AfricaEastern AsiaEastern EuropeEcuadorEgyptEl SalvadorEnglandEritreaEthiopiaEuropeFijiFranceGermanyGhanaGreeceGrenadaGuatemalaGuyanaHaitiHondurasHong KongHungaryIndiaIndonesiaIranIraqIrelandIsraelItalyJamaicaJapanJordanKazakhstanKenyaKoreaKuwaitLaosLatin AmericaLatviaLebanonLiberiaLithuaniaMalaysiaMexicoMicronesiaMiddle AfricaMoldovaMoroccoNepalNetherlandsNicaraguaNigeriaNorth AmericaNorth MacedoniaNorthern AfricaNorthern EuropeNorwayOceaniaPakistanPanamaPeruPhilippinesPolandPortugalRomaniaRussiaSaudi ArabiaScotlandSenegalSerbiaSierra LeoneSingaporeSomaliaSouth AfricaSouth AmericaSouth Central AsiaSouth Eastern AsiaSouthern EuropeSpainSri LankaSt. Vincent and the GrenadinesSudanSwedenSwitzerlandSyriaTaiwanThailandTrinidad and TobagoTurkeyUgandaUkraineUruguayUzbekistanVenezuelaVietnamWest IndiesWestern AfricaWestern AsiaWestern EuropeYemenZaireZimbabweAzores
Disability Age 65 to 74
Income
Poverty
Unemployment
Labor Participation
Family Structure
Vehicle Availability
Education Level
Disability

Disability Age 65 to 74 Comparison

Romanians

Natives/Alaskans

Exceptional
Tragic
22.1%
DISABILITY AGE 65 TO 74
97.7/ 100
METRIC RATING
95th/ 347
METRIC RANK
30.4%
DISABILITY AGE 65 TO 74
0.0/ 100
METRIC RATING
332nd/ 347
METRIC RANK

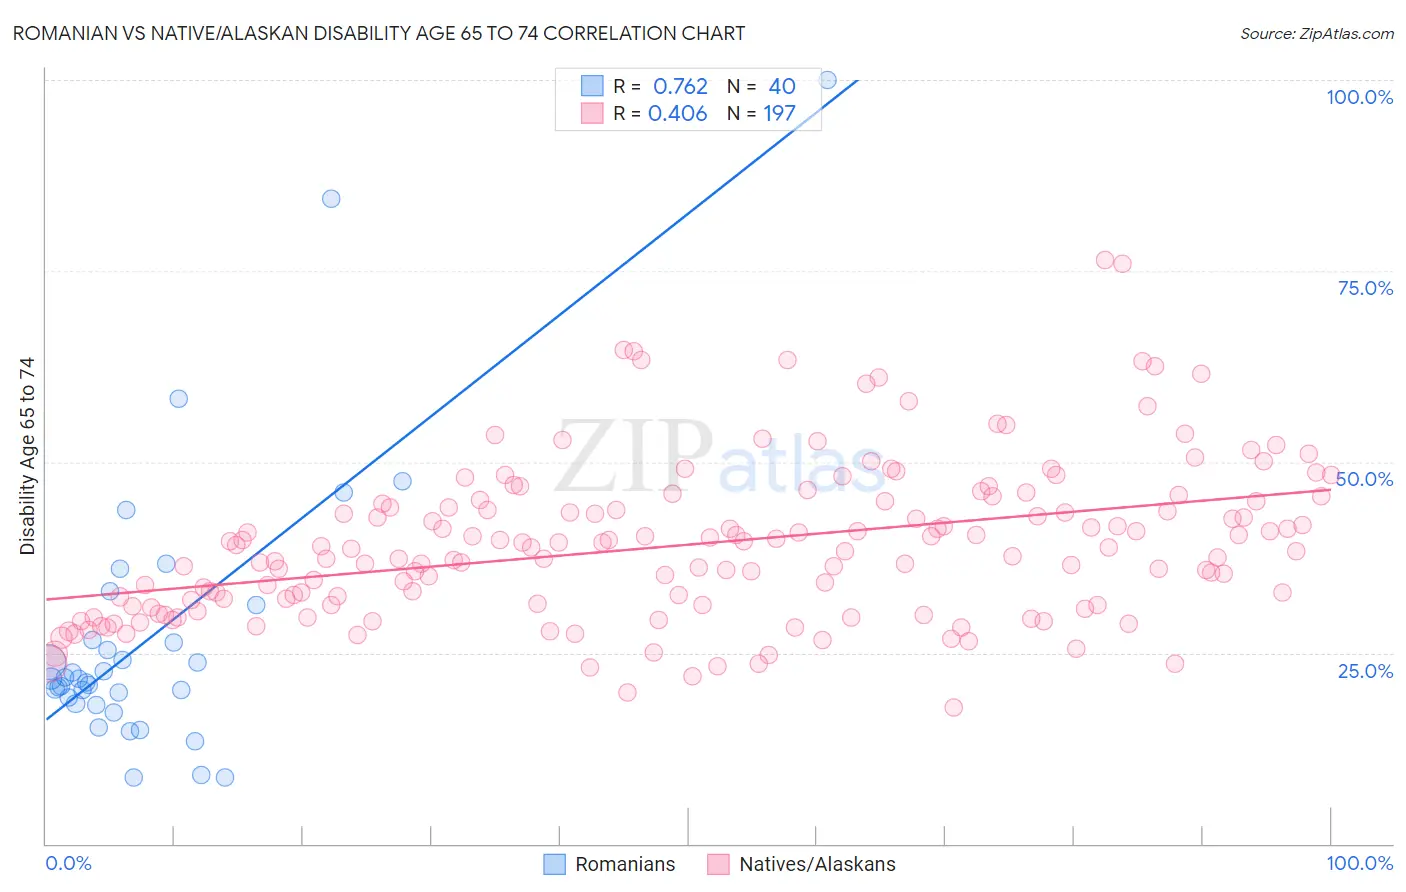
Romanian vs Native/Alaskan Disability Age 65 to 74 Correlation Chart

The statistical analysis conducted on geographies consisting of 377,283,716 people shows a strong positive correlation between the proportion of Romanians and percentage of population with a disability between the ages 65 and 75 in the United States with a correlation coefficient (R) of 0.762 and weighted average of 22.1%. Similarly, the statistical analysis conducted on geographies consisting of 511,555,776 people shows a moderate positive correlation between the proportion of Natives/Alaskans and percentage of population with a disability between the ages 65 and 75 in the United States with a correlation coefficient (R) of 0.406 and weighted average of 30.4%, a difference of 37.7%.
Romanian vs Native/Alaskan Disability Age 65 to 74

Disability Age 65 to 74 Correlation Summary

MeasurementRomanianNative/Alaskan
Minimum8.6%17.9%
Maximum100.0%76.4%
Range91.4%58.5%
Mean27.4%39.2%
Median21.6%38.6%
Interquartile 25% (IQ1)18.7%31.2%
Interquartile 75% (IQ3)29.0%44.7%
Interquartile Range (IQR)10.3%13.4%
Standard Deviation (Sample)18.5%10.3%
Standard Deviation (Population)18.3%10.3%

Similar Demographics by Disability Age 65 to 74

Demographics Similar to Romanians by Disability Age 65 to 74

In terms of disability age 65 to 74, the demographic groups most similar to Romanians are Immigrants from Chile (22.1%, a difference of 0.060%), Immigrants from Canada (22.1%, a difference of 0.080%), Polish (22.0%, a difference of 0.11%), Immigrants from North America (22.1%, a difference of 0.11%), and Chilean (22.0%, a difference of 0.16%).
DemographicsRating | RankDisability Age 65 to 74
Immigrants | Netherlands
97.9
/100
|
#88
Exceptional
22.0%
Immigrants | Kuwait
97.9
/100
|
#89
Exceptional
22.0%
Italians
97.9
/100
|
#90
Exceptional
22.0%
Chileans
97.9
/100
|
#91
Exceptional
22.0%
Poles
97.8
/100
|
#92
Exceptional
22.0%
Immigrants | Canada
97.8
/100
|
#93
Exceptional
22.1%
Immigrants | Chile
97.7
/100
|
#94
Exceptional
22.1%
Romanians
97.7
/100
|
#95
Exceptional
22.1%
Immigrants | North America
97.5
/100
|
#96
Exceptional
22.1%
Immigrants | Southern Europe
97.2
/100
|
#97
Exceptional
22.1%
Jordanians
96.9
/100
|
#98
Exceptional
22.2%
Immigrants | Colombia
96.8
/100
|
#99
Exceptional
22.2%
Uruguayans
96.5
/100
|
#100
Exceptional
22.2%
Immigrants | England
96.5
/100
|
#101
Exceptional
22.2%
Immigrants | Saudi Arabia
96.4
/100
|
#102
Exceptional
22.2%

Demographics Similar to Natives/Alaskans by Disability Age 65 to 74

In terms of disability age 65 to 74, the demographic groups most similar to Natives/Alaskans are Colville (30.5%, a difference of 0.52%), Chickasaw (30.2%, a difference of 0.62%), Creek (30.2%, a difference of 0.63%), Choctaw (30.2%, a difference of 0.66%), and Alaska Native (30.6%, a difference of 0.77%).
DemographicsRating | RankDisability Age 65 to 74
Dutch West Indians
0.0
/100
|
#325
Tragic
29.6%
Yakama
0.0
/100
|
#326
Tragic
29.6%
Apache
0.0
/100
|
#327
Tragic
29.7%
Hopi
0.0
/100
|
#328
Tragic
30.0%
Choctaw
0.0
/100
|
#329
Tragic
30.2%
Creek
0.0
/100
|
#330
Tragic
30.2%
Chickasaw
0.0
/100
|
#331
Tragic
30.2%
Natives/Alaskans
0.0
/100
|
#332
Tragic
30.4%
Colville
0.0
/100
|
#333
Tragic
30.5%
Alaska Natives
0.0
/100
|
#334
Tragic
30.6%
Cheyenne
0.0
/100
|
#335
Tragic
31.1%
Yuman
0.0
/100
|
#336
Tragic
31.5%
Houma
0.0
/100
|
#337
Tragic
32.3%
Alaskan Athabascans
0.0
/100
|
#338
Tragic
32.4%
Kiowa
0.0
/100
|
#339
Tragic
32.6%