Romanian vs Immigrants from Uganda Cognitive Disability

COMPARE

Romanian
Race
Ancestry
AfghanAfricanAlaska NativeAlaskan AthabascanAlbanianAleutAlsatianAmericanApacheArabArapahoArgentineanArmenianAssyrian/Chaldean/SyriacAustralianAustrianBahamianBangladeshiBarbadianBasqueBelgianBelizeanBermudanBhutaneseBlackfeetBolivianBrazilianBritishBritish West IndianBulgarianBurmeseCajunCambodianCanadianCape VerdeanCarpatho RusynCelticCentral AmericanCentral American IndianCherokeeCheyenneChickasawChileanChineseChippewaChoctawColombianColvilleComancheCosta RicanCreeCreekCroatianCrowCubanCypriotCzechCzechoslovakianDanishDelawareDominicanDutchDutch West IndianEastern EuropeanEcuadorianEgyptianEnglishEstonianEthiopianEuropeanFijianFilipinoFinnishFrenchFrench American IndianFrench CanadianGermanGerman RussianGhanaianGreekGuamanian/ChamorroGuatemalanGuyaneseHaitianHmongHonduranHopiHoumaHungarianIcelanderIndian (Asian)IndonesianInupiatIranianIraqiIrishIroquoisIsraeliItalianJamaicanJapaneseJordanianKenyanKiowaKoreanLaotianLatvianLebaneseLiberianLithuanianLumbeeLuxembourgerMacedonianMalaysianMalteseMarshalleseMenomineeMexicanMexican American IndianMongolianMoroccanNative HawaiianNavajoNepaleseNew ZealanderNicaraguanNigerianNorthern EuropeanNorwegianOkinawanOsageOttawaPaiutePakistaniPalestinianPanamanianParaguayanPennsylvania GermanPeruvianPimaPolishPortuguesePotawatomiPuebloPuerto RicanPuget Sound SalishRomanianRussianSalvadoranSamoanScandinavianScotch-IrishScottishSeminoleSenegaleseSerbianShoshoneSierra LeoneanSiouxSlavicSlovakSloveneSomaliSouth AfricanSouth AmericanSouth American IndianSoviet UnionSpaniardSpanishSpanish AmericanSpanish American IndianSri LankanSubsaharan AfricanSudaneseSwedishSwissSyrianTaiwaneseThaiTlingit-HaidaTohono O'OdhamTonganTrinidadian and TobagonianTsimshianTurkishU.S. Virgin IslanderUgandanUkrainianUruguayanUteVenezuelanVietnameseWelshWest IndianYakamaYaquiYugoslavianYumanYup'ikZimbabwean
Immigration
NonimmigrantsImmigrantsAfghanistanAfricaAlbaniaArgentinaArmeniaAsiaAustraliaAustriaBahamasBangladeshBarbadosBelarusBelgiumBelizeBoliviaBosnia and HerzegovinaBrazilBulgariaBurma/MyanmarCabo VerdeCambodiaCameroonCanadaCaribbeanCentral AmericaChileChinaColombiaCongoCosta RicaCroatiaCubaCzechoslovakiaDenmarkDominicaDominican RepublicEastern AfricaEastern AsiaEastern EuropeEcuadorEgyptEl SalvadorEnglandEritreaEthiopiaEuropeFijiFranceGermanyGhanaGreeceGrenadaGuatemalaGuyanaHaitiHondurasHong KongHungaryIndiaIndonesiaIranIraqIrelandIsraelItalyJamaicaJapanJordanKazakhstanKenyaKoreaKuwaitLaosLatin AmericaLatviaLebanonLiberiaLithuaniaMalaysiaMexicoMicronesiaMiddle AfricaMoldovaMoroccoNepalNetherlandsNicaraguaNigeriaNorth AmericaNorth MacedoniaNorthern AfricaNorthern EuropeNorwayOceaniaPakistanPanamaPeruPhilippinesPolandPortugalRomaniaRussiaSaudi ArabiaScotlandSenegalSerbiaSierra LeoneSingaporeSomaliaSouth AfricaSouth AmericaSouth Central AsiaSouth Eastern AsiaSouthern EuropeSpainSri LankaSt. Vincent and the GrenadinesSudanSwedenSwitzerlandSyriaTaiwanThailandTrinidad and TobagoTurkeyUkraineUruguayUzbekistanVenezuelaVietnamWest IndiesWestern AfricaWestern AsiaWestern EuropeYemenZaireZimbabweAzores
Immigrants from Uganda
Race
Ancestry
AfghanAfricanAlaska NativeAlaskan AthabascanAlbanianAleutAlsatianAmericanApacheArabArapahoArgentineanArmenianAssyrian/Chaldean/SyriacAustralianAustrianBahamianBangladeshiBarbadianBasqueBelgianBelizeanBermudanBhutaneseBlackfeetBolivianBrazilianBritishBritish West IndianBulgarianBurmeseCajunCambodianCanadianCape VerdeanCarpatho RusynCelticCentral AmericanCentral American IndianCherokeeCheyenneChickasawChileanChineseChippewaChoctawColombianColvilleComancheCosta RicanCreeCreekCroatianCrowCubanCypriotCzechCzechoslovakianDanishDelawareDominicanDutchDutch West IndianEastern EuropeanEcuadorianEgyptianEnglishEstonianEthiopianEuropeanFijianFilipinoFinnishFrenchFrench American IndianFrench CanadianGermanGerman RussianGhanaianGreekGuamanian/ChamorroGuatemalanGuyaneseHaitianHmongHonduranHopiHoumaHungarianIcelanderIndian (Asian)IndonesianInupiatIranianIraqiIrishIroquoisIsraeliItalianJamaicanJapaneseJordanianKenyanKiowaKoreanLaotianLatvianLebaneseLiberianLithuanianLumbeeLuxembourgerMacedonianMalaysianMalteseMarshalleseMenomineeMexicanMexican American IndianMongolianMoroccanNative HawaiianNavajoNepaleseNew ZealanderNicaraguanNigerianNorthern EuropeanNorwegianOkinawanOsageOttawaPaiutePakistaniPalestinianPanamanianParaguayanPennsylvania GermanPeruvianPimaPolishPortuguesePotawatomiPuebloPuerto RicanPuget Sound SalishRussianSalvadoranSamoanScandinavianScotch-IrishScottishSeminoleSenegaleseSerbianShoshoneSierra LeoneanSiouxSlavicSlovakSloveneSomaliSouth AfricanSouth AmericanSouth American IndianSoviet UnionSpaniardSpanishSpanish AmericanSpanish American IndianSri LankanSubsaharan AfricanSudaneseSwedishSwissSyrianTaiwaneseThaiTlingit-HaidaTohono O'OdhamTonganTrinidadian and TobagonianTsimshianTurkishU.S. Virgin IslanderUgandanUkrainianUruguayanUteVenezuelanVietnameseWelshWest IndianYakamaYaquiYugoslavianYumanYup'ikZimbabwean
Immigration
NonimmigrantsImmigrantsAfghanistanAfricaAlbaniaArgentinaArmeniaAsiaAustraliaAustriaBahamasBangladeshBarbadosBelarusBelgiumBelizeBoliviaBosnia and HerzegovinaBrazilBulgariaBurma/MyanmarCabo VerdeCambodiaCameroonCanadaCaribbeanCentral AmericaChileChinaColombiaCongoCosta RicaCroatiaCubaCzechoslovakiaDenmarkDominicaDominican RepublicEastern AfricaEastern AsiaEastern EuropeEcuadorEgyptEl SalvadorEnglandEritreaEthiopiaEuropeFijiFranceGermanyGhanaGreeceGrenadaGuatemalaGuyanaHaitiHondurasHong KongHungaryIndiaIndonesiaIranIraqIrelandIsraelItalyJamaicaJapanJordanKazakhstanKenyaKoreaKuwaitLaosLatin AmericaLatviaLebanonLiberiaLithuaniaMalaysiaMexicoMicronesiaMiddle AfricaMoldovaMoroccoNepalNetherlandsNicaraguaNigeriaNorth AmericaNorth MacedoniaNorthern AfricaNorthern EuropeNorwayOceaniaPakistanPanamaPeruPhilippinesPolandPortugalRomaniaRussiaSaudi ArabiaScotlandSenegalSerbiaSierra LeoneSingaporeSomaliaSouth AfricaSouth AmericaSouth Central AsiaSouth Eastern AsiaSouthern EuropeSpainSri LankaSt. Vincent and the GrenadinesSudanSwedenSwitzerlandSyriaTaiwanThailandTrinidad and TobagoTurkeyUgandaUkraineUruguayUzbekistanVenezuelaVietnamWest IndiesWestern AfricaWestern AsiaWestern EuropeYemenZaireZimbabweAzores
Cognitive Disability
Income
Poverty
Unemployment
Labor Participation
Family Structure
Vehicle Availability
Education Level
Disability

Cognitive Disability Comparison

Romanians

Immigrants from Uganda

Exceptional
Tragic
16.6%
COGNITIVE DISABILITY
99.7/ 100
METRIC RATING
60th/ 347
METRIC RANK
18.1%
COGNITIVE DISABILITY
0.1/ 100
METRIC RATING
284th/ 347
METRIC RANK

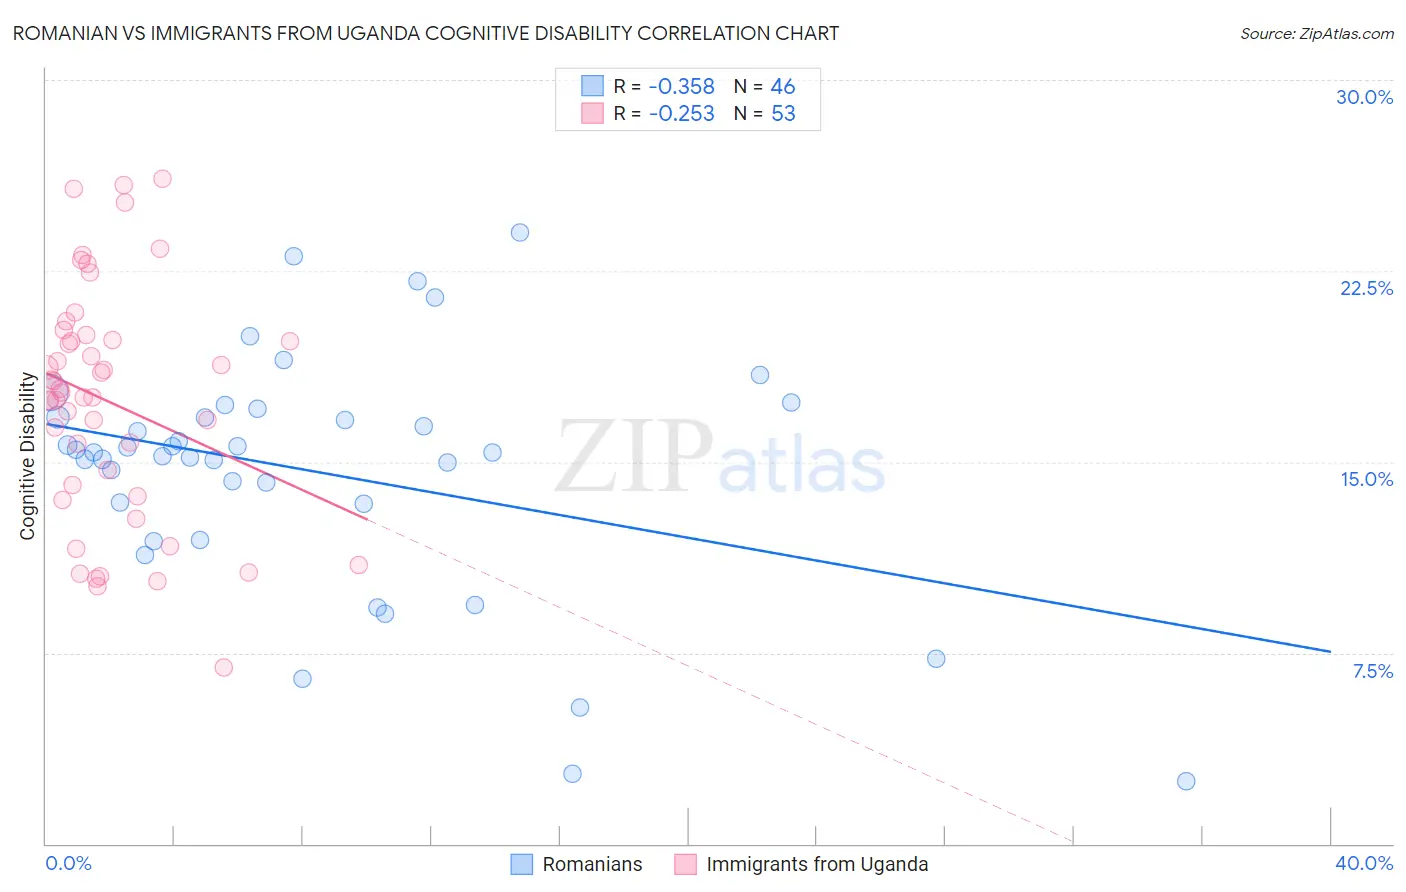
Romanian vs Immigrants from Uganda Cognitive Disability Correlation Chart

The statistical analysis conducted on geographies consisting of 377,876,642 people shows a mild negative correlation between the proportion of Romanians and percentage of population with cognitive disability in the United States with a correlation coefficient (R) of -0.358 and weighted average of 16.6%. Similarly, the statistical analysis conducted on geographies consisting of 125,981,524 people shows a weak negative correlation between the proportion of Immigrants from Uganda and percentage of population with cognitive disability in the United States with a correlation coefficient (R) of -0.253 and weighted average of 18.1%, a difference of 9.3%.
Romanian vs Immigrants from Uganda Cognitive Disability

Cognitive Disability Correlation Summary

MeasurementRomanianImmigrants from Uganda
Minimum2.4%6.9%
Maximum24.0%26.1%
Range21.6%19.2%
Mean14.6%17.4%
Median15.4%17.7%
Interquartile 25% (IQ1)13.3%13.9%
Interquartile 75% (IQ3)16.7%19.9%
Interquartile Range (IQR)3.4%6.0%
Standard Deviation (Sample)4.7%4.6%
Standard Deviation (Population)4.6%4.5%

Similar Demographics by Cognitive Disability

Demographics Similar to Romanians by Cognitive Disability

In terms of cognitive disability, the demographic groups most similar to Romanians are Pennsylvania German (16.6%, a difference of 0.010%), Immigrants from Peru (16.6%, a difference of 0.010%), Immigrants from England (16.6%, a difference of 0.060%), Austrian (16.6%, a difference of 0.090%), and Bhutanese (16.6%, a difference of 0.090%).
DemographicsRating | RankCognitive Disability
Swedes
99.8
/100
|
#53
Exceptional
16.5%
Immigrants | Iran
99.8
/100
|
#54
Exceptional
16.5%
Immigrants | Venezuela
99.7
/100
|
#55
Exceptional
16.5%
Austrians
99.7
/100
|
#56
Exceptional
16.6%
Bhutanese
99.7
/100
|
#57
Exceptional
16.6%
Pennsylvania Germans
99.7
/100
|
#58
Exceptional
16.6%
Immigrants | Peru
99.7
/100
|
#59
Exceptional
16.6%
Romanians
99.7
/100
|
#60
Exceptional
16.6%
Immigrants | England
99.6
/100
|
#61
Exceptional
16.6%
Czechoslovakians
99.6
/100
|
#62
Exceptional
16.6%
Argentineans
99.6
/100
|
#63
Exceptional
16.6%
Venezuelans
99.6
/100
|
#64
Exceptional
16.6%
Colombians
99.6
/100
|
#65
Exceptional
16.6%
Immigrants | Ukraine
99.5
/100
|
#66
Exceptional
16.6%
Latvians
99.5
/100
|
#67
Exceptional
16.6%

Demographics Similar to Immigrants from Uganda by Cognitive Disability

In terms of cognitive disability, the demographic groups most similar to Immigrants from Uganda are Bermudan (18.1%, a difference of 0.010%), Nigerian (18.1%, a difference of 0.040%), Kenyan (18.1%, a difference of 0.050%), Immigrants from Cambodia (18.1%, a difference of 0.060%), and Yakama (18.1%, a difference of 0.090%).
DemographicsRating | RankCognitive Disability
Immigrants | Kuwait
0.2
/100
|
#277
Tragic
18.1%
Immigrants | Micronesia
0.2
/100
|
#278
Tragic
18.1%
Chippewa
0.1
/100
|
#279
Tragic
18.1%
West Indians
0.1
/100
|
#280
Tragic
18.1%
Yakama
0.1
/100
|
#281
Tragic
18.1%
Immigrants | Cambodia
0.1
/100
|
#282
Tragic
18.1%
Nigerians
0.1
/100
|
#283
Tragic
18.1%
Immigrants | Uganda
0.1
/100
|
#284
Tragic
18.1%
Bermudans
0.1
/100
|
#285
Tragic
18.1%
Kenyans
0.1
/100
|
#286
Tragic
18.1%
Dutch West Indians
0.1
/100
|
#287
Tragic
18.1%
Immigrants | West Indies
0.1
/100
|
#288
Tragic
18.1%
Natives/Alaskans
0.1
/100
|
#289
Tragic
18.1%
Immigrants | Africa
0.1
/100
|
#290
Tragic
18.1%
Ottawa
0.1
/100
|
#291
Tragic
18.2%