Puget Sound Salish vs Mexican Hearing Disability
COMPARE
Puget Sound Salish
Mexican
Hearing Disability
Hearing Disability Comparison
Puget Sound Salish
Mexicans
3.9%
HEARING DISABILITY
0.0/ 100
METRIC RATING
315th/ 347
METRIC RANK
3.2%
HEARING DISABILITY
5.6/ 100
METRIC RATING
223rd/ 347
METRIC RANK
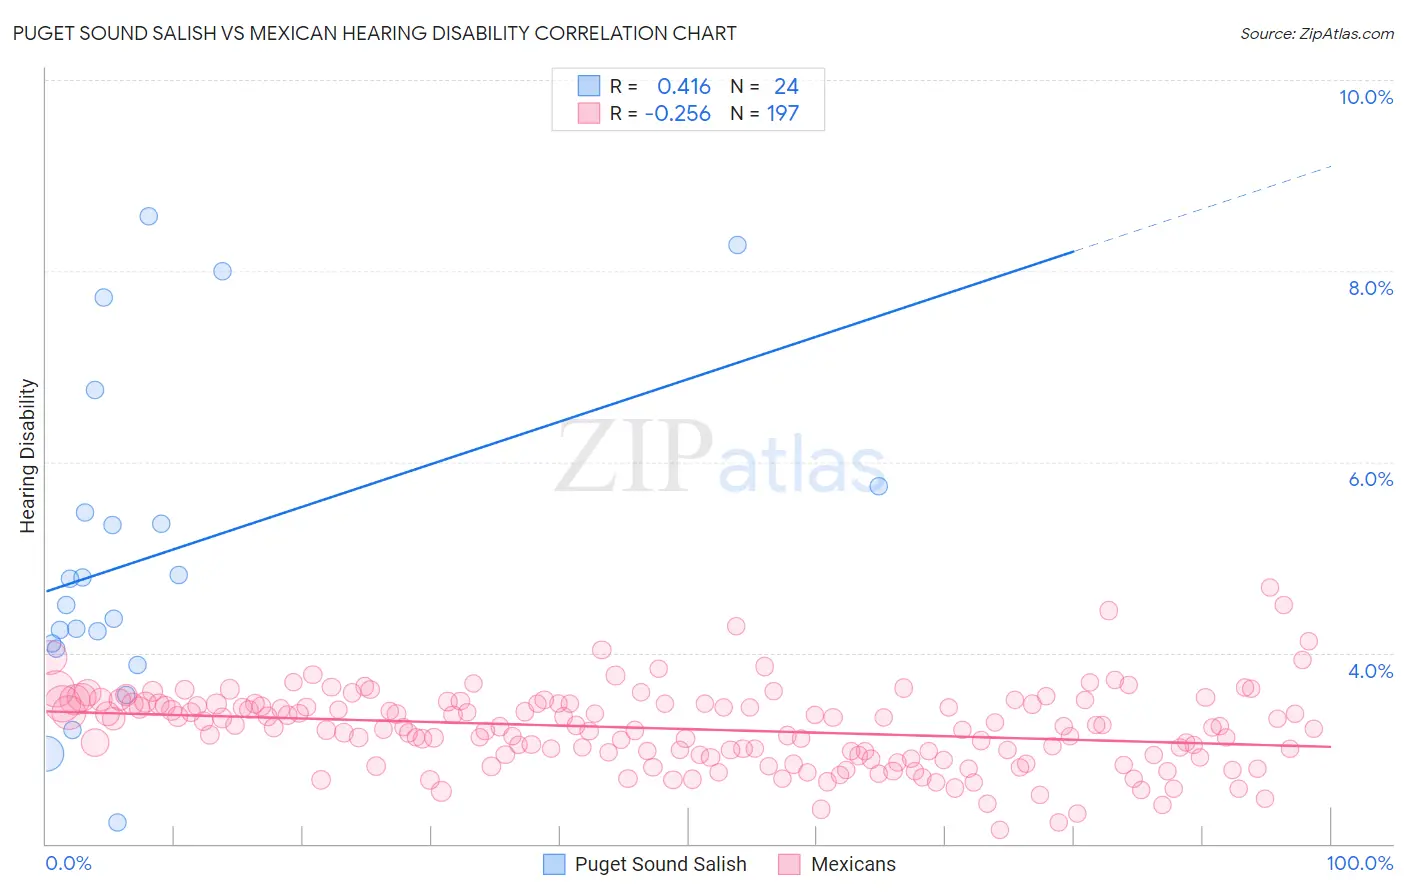
Puget Sound Salish vs Mexican Hearing Disability Correlation Chart
The statistical analysis conducted on geographies consisting of 46,152,047 people shows a moderate positive correlation between the proportion of Puget Sound Salish and percentage of population with hearing disability in the United States with a correlation coefficient (R) of 0.416 and weighted average of 3.9%. Similarly, the statistical analysis conducted on geographies consisting of 564,483,125 people shows a weak negative correlation between the proportion of Mexicans and percentage of population with hearing disability in the United States with a correlation coefficient (R) of -0.256 and weighted average of 3.2%, a difference of 23.6%.
Hearing Disability Correlation Summary
| Measurement | Puget Sound Salish | Mexican |
| Minimum | 2.2% | 2.1% |
| Maximum | 8.6% | 4.7% |
| Range | 6.3% | 2.5% |
| Mean | 5.0% | 3.2% |
| Median | 4.6% | 3.2% |
| Interquartile 25% (IQ1) | 4.1% | 2.9% |
| Interquartile 75% (IQ3) | 5.6% | 3.5% |
| Interquartile Range (IQR) | 1.5% | 0.56% |
| Standard Deviation (Sample) | 1.7% | 0.41% |
| Standard Deviation (Population) | 1.7% | 0.41% |
Similar Demographics by Hearing Disability
Demographics Similar to Puget Sound Salish by Hearing Disability
In terms of hearing disability, the demographic groups most similar to Puget Sound Salish are Yakama (3.9%, a difference of 0.010%), Hopi (3.9%, a difference of 0.18%), Spanish American (4.0%, a difference of 0.20%), Cajun (3.9%, a difference of 0.29%), and Comanche (4.0%, a difference of 0.33%).
| Demographics | Rating | Rank | Hearing Disability |
| Ottawa | 0.0 /100 | #308 | Tragic 3.8% |
| Scotch-Irish | 0.0 /100 | #309 | Tragic 3.8% |
| Cree | 0.0 /100 | #310 | Tragic 3.8% |
| Americans | 0.0 /100 | #311 | Tragic 3.9% |
| Cajuns | 0.0 /100 | #312 | Tragic 3.9% |
| Hopi | 0.0 /100 | #313 | Tragic 3.9% |
| Yakama | 0.0 /100 | #314 | Tragic 3.9% |
| Puget Sound Salish | 0.0 /100 | #315 | Tragic 3.9% |
| Spanish Americans | 0.0 /100 | #316 | Tragic 4.0% |
| Comanche | 0.0 /100 | #317 | Tragic 4.0% |
| Cheyenne | 0.0 /100 | #318 | Tragic 4.0% |
| Chippewa | 0.0 /100 | #319 | Tragic 4.0% |
| Shoshone | 0.0 /100 | #320 | Tragic 4.0% |
| Paiute | 0.0 /100 | #321 | Tragic 4.1% |
| Seminole | 0.0 /100 | #322 | Tragic 4.1% |
Demographics Similar to Mexicans by Hearing Disability
In terms of hearing disability, the demographic groups most similar to Mexicans are Icelander (3.2%, a difference of 0.17%), Latvian (3.2%, a difference of 0.21%), Lebanese (3.2%, a difference of 0.25%), Immigrants from Oceania (3.2%, a difference of 0.36%), and Immigrants from Laos (3.2%, a difference of 0.40%).
| Demographics | Rating | Rank | Hearing Disability |
| Immigrants | Norway | 7.3 /100 | #216 | Tragic 3.2% |
| Russians | 7.1 /100 | #217 | Tragic 3.2% |
| Immigrants | Northern Europe | 7.0 /100 | #218 | Tragic 3.2% |
| New Zealanders | 6.8 /100 | #219 | Tragic 3.2% |
| Malaysians | 6.6 /100 | #220 | Tragic 3.2% |
| Immigrants | Laos | 6.6 /100 | #221 | Tragic 3.2% |
| Immigrants | Oceania | 6.5 /100 | #222 | Tragic 3.2% |
| Mexicans | 5.6 /100 | #223 | Tragic 3.2% |
| Icelanders | 5.2 /100 | #224 | Tragic 3.2% |
| Latvians | 5.1 /100 | #225 | Tragic 3.2% |
| Lebanese | 5.0 /100 | #226 | Tragic 3.2% |
| Bhutanese | 4.6 /100 | #227 | Tragic 3.2% |
| Immigrants | Portugal | 4.3 /100 | #228 | Tragic 3.2% |
| Maltese | 4.1 /100 | #229 | Tragic 3.2% |
| Greeks | 3.2 /100 | #230 | Tragic 3.2% |