Puget Sound Salish vs Italian Cognitive Disability
COMPARE
Puget Sound Salish
Italian
Cognitive Disability
Cognitive Disability Comparison
Puget Sound Salish
Italians
17.5%
COGNITIVE DISABILITY
10.9/ 100
METRIC RATING
205th/ 347
METRIC RANK
16.4%
COGNITIVE DISABILITY
99.9/ 100
METRIC RATING
33rd/ 347
METRIC RANK
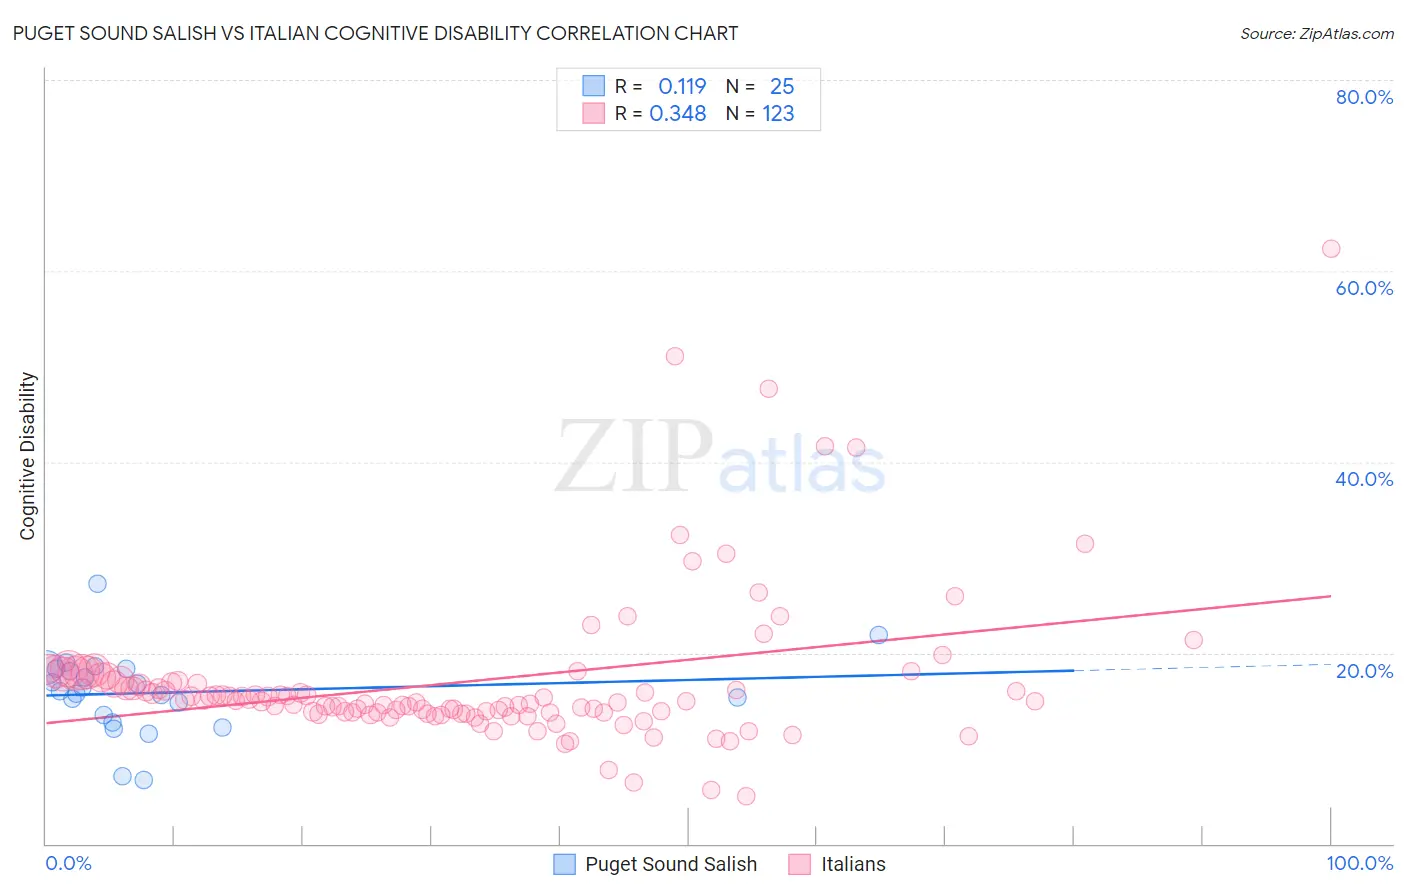
Puget Sound Salish vs Italian Cognitive Disability Correlation Chart
The statistical analysis conducted on geographies consisting of 46,155,775 people shows a poor positive correlation between the proportion of Puget Sound Salish and percentage of population with cognitive disability in the United States with a correlation coefficient (R) of 0.119 and weighted average of 17.5%. Similarly, the statistical analysis conducted on geographies consisting of 574,911,788 people shows a mild positive correlation between the proportion of Italians and percentage of population with cognitive disability in the United States with a correlation coefficient (R) of 0.348 and weighted average of 16.4%, a difference of 6.8%.
Cognitive Disability Correlation Summary
| Measurement | Puget Sound Salish | Italian |
| Minimum | 6.7% | 4.9% |
| Maximum | 27.3% | 62.3% |
| Range | 20.6% | 57.4% |
| Mean | 15.8% | 16.9% |
| Median | 16.0% | 15.0% |
| Interquartile 25% (IQ1) | 13.0% | 13.7% |
| Interquartile 75% (IQ3) | 18.3% | 17.1% |
| Interquartile Range (IQR) | 5.3% | 3.3% |
| Standard Deviation (Sample) | 4.3% | 8.0% |
| Standard Deviation (Population) | 4.2% | 8.0% |
Similar Demographics by Cognitive Disability
Demographics Similar to Puget Sound Salish by Cognitive Disability
In terms of cognitive disability, the demographic groups most similar to Puget Sound Salish are Immigrants from Caribbean (17.5%, a difference of 0.010%), Immigrants from Zimbabwe (17.5%, a difference of 0.010%), Alaska Native (17.5%, a difference of 0.040%), Immigrants from Morocco (17.5%, a difference of 0.080%), and Immigrants from Latin America (17.6%, a difference of 0.090%).
| Demographics | Rating | Rank | Cognitive Disability |
| Immigrants | Panama | 14.8 /100 | #198 | Poor 17.5% |
| Immigrants | Singapore | 14.3 /100 | #199 | Poor 17.5% |
| Haitians | 14.1 /100 | #200 | Poor 17.5% |
| South American Indians | 13.0 /100 | #201 | Poor 17.5% |
| Immigrants | Morocco | 12.0 /100 | #202 | Poor 17.5% |
| Immigrants | Caribbean | 11.0 /100 | #203 | Poor 17.5% |
| Immigrants | Zimbabwe | 11.0 /100 | #204 | Poor 17.5% |
| Puget Sound Salish | 10.9 /100 | #205 | Poor 17.5% |
| Alaska Natives | 10.4 /100 | #206 | Poor 17.5% |
| Immigrants | Latin America | 9.7 /100 | #207 | Tragic 17.6% |
| Immigrants | Cameroon | 9.3 /100 | #208 | Tragic 17.6% |
| Immigrants | Trinidad and Tobago | 8.7 /100 | #209 | Tragic 17.6% |
| Immigrants | Jamaica | 8.5 /100 | #210 | Tragic 17.6% |
| Taiwanese | 7.7 /100 | #211 | Tragic 17.6% |
| Immigrants | Oceania | 7.3 /100 | #212 | Tragic 17.6% |
Demographics Similar to Italians by Cognitive Disability
In terms of cognitive disability, the demographic groups most similar to Italians are Russian (16.4%, a difference of 0.0%), Immigrants from Israel (16.4%, a difference of 0.070%), Slovak (16.4%, a difference of 0.080%), Greek (16.4%, a difference of 0.090%), and Immigrants from Romania (16.4%, a difference of 0.13%).
| Demographics | Rating | Rank | Cognitive Disability |
| Immigrants | Croatia | 99.9 /100 | #26 | Exceptional 16.4% |
| Immigrants | Pakistan | 99.9 /100 | #27 | Exceptional 16.4% |
| Poles | 99.9 /100 | #28 | Exceptional 16.4% |
| Filipinos | 99.9 /100 | #29 | Exceptional 16.4% |
| Czechs | 99.9 /100 | #30 | Exceptional 16.4% |
| Immigrants | Romania | 99.9 /100 | #31 | Exceptional 16.4% |
| Immigrants | Israel | 99.9 /100 | #32 | Exceptional 16.4% |
| Italians | 99.9 /100 | #33 | Exceptional 16.4% |
| Russians | 99.9 /100 | #34 | Exceptional 16.4% |
| Slovaks | 99.9 /100 | #35 | Exceptional 16.4% |
| Greeks | 99.9 /100 | #36 | Exceptional 16.4% |
| Slovenes | 99.9 /100 | #37 | Exceptional 16.5% |
| Immigrants | Eastern Europe | 99.9 /100 | #38 | Exceptional 16.5% |
| Bolivians | 99.9 /100 | #39 | Exceptional 16.5% |
| Immigrants | Belarus | 99.9 /100 | #40 | Exceptional 16.5% |