Pueblo vs Salvadoran Ambulatory Disability
COMPARE
Pueblo
Salvadoran
Ambulatory Disability
Ambulatory Disability Comparison
Pueblo
Salvadorans
7.6%
AMBULATORY DISABILITY
0.0/ 100
METRIC RATING
329th/ 347
METRIC RANK
5.8%
AMBULATORY DISABILITY
98.4/ 100
METRIC RATING
96th/ 347
METRIC RANK
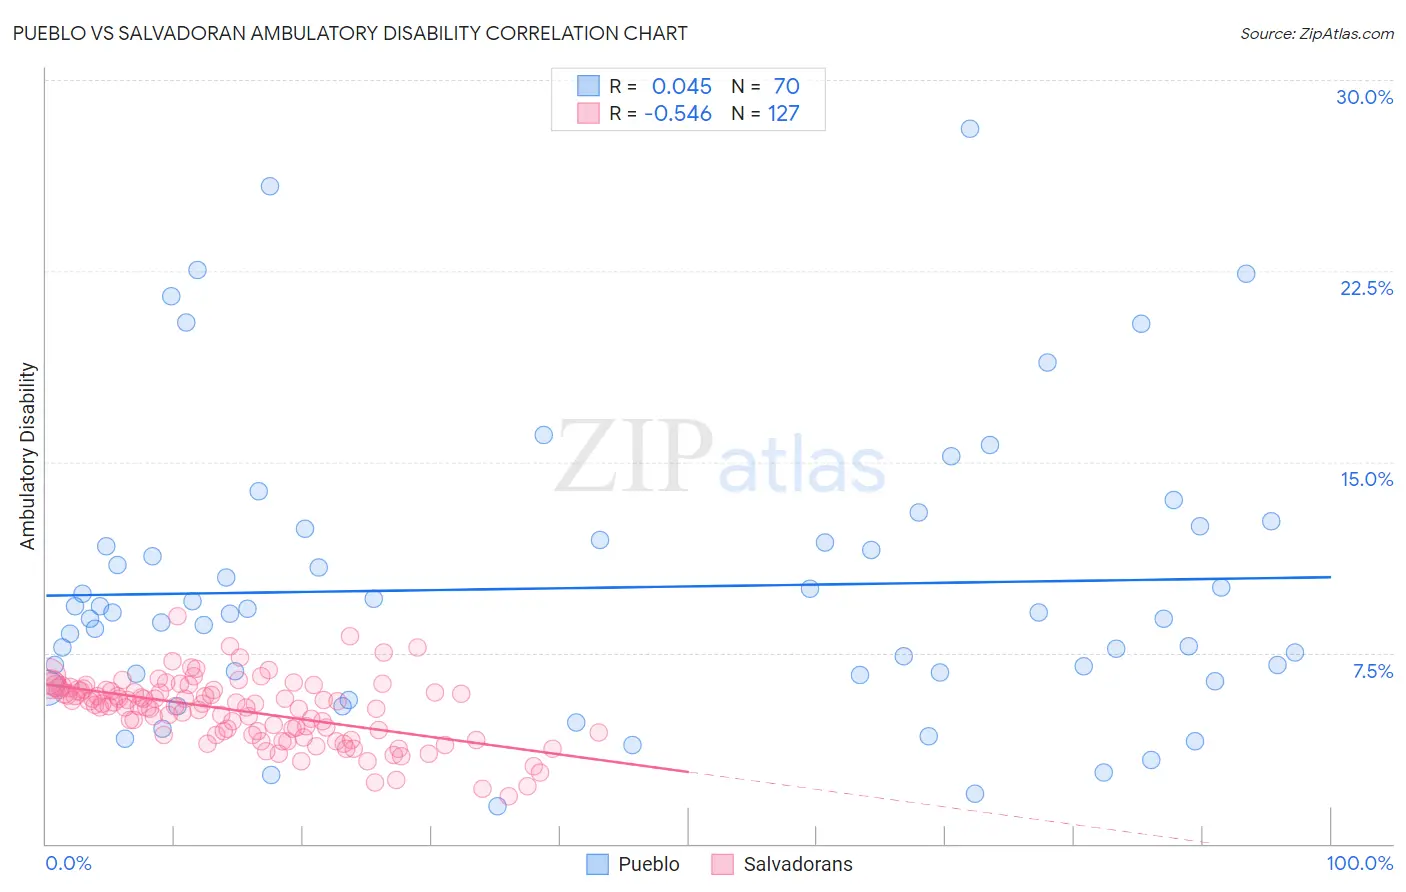
Pueblo vs Salvadoran Ambulatory Disability Correlation Chart
The statistical analysis conducted on geographies consisting of 120,067,140 people shows no correlation between the proportion of Pueblo and percentage of population with ambulatory disability in the United States with a correlation coefficient (R) of 0.045 and weighted average of 7.6%. Similarly, the statistical analysis conducted on geographies consisting of 398,824,360 people shows a substantial negative correlation between the proportion of Salvadorans and percentage of population with ambulatory disability in the United States with a correlation coefficient (R) of -0.546 and weighted average of 5.8%, a difference of 31.3%.
Ambulatory Disability Correlation Summary
| Measurement | Pueblo | Salvadoran |
| Minimum | 1.5% | 1.9% |
| Maximum | 28.1% | 8.9% |
| Range | 26.6% | 7.0% |
| Mean | 10.1% | 5.2% |
| Median | 9.1% | 5.5% |
| Interquartile 25% (IQ1) | 6.7% | 4.3% |
| Interquartile 75% (IQ3) | 11.9% | 6.0% |
| Interquartile Range (IQR) | 5.2% | 1.8% |
| Standard Deviation (Sample) | 5.6% | 1.3% |
| Standard Deviation (Population) | 5.6% | 1.3% |
Similar Demographics by Ambulatory Disability
Demographics Similar to Pueblo by Ambulatory Disability
In terms of ambulatory disability, the demographic groups most similar to Pueblo are Hopi (7.6%, a difference of 0.040%), Native/Alaskan (7.5%, a difference of 0.98%), Black/African American (7.5%, a difference of 0.99%), Comanche (7.5%, a difference of 1.1%), and Navajo (7.5%, a difference of 1.2%).
| Demographics | Rating | Rank | Ambulatory Disability |
| Osage | 0.0 /100 | #322 | Tragic 7.4% |
| Americans | 0.0 /100 | #323 | Tragic 7.4% |
| Navajo | 0.0 /100 | #324 | Tragic 7.5% |
| Comanche | 0.0 /100 | #325 | Tragic 7.5% |
| Blacks/African Americans | 0.0 /100 | #326 | Tragic 7.5% |
| Natives/Alaskans | 0.0 /100 | #327 | Tragic 7.5% |
| Hopi | 0.0 /100 | #328 | Tragic 7.6% |
| Pueblo | 0.0 /100 | #329 | Tragic 7.6% |
| Paiute | 0.0 /100 | #330 | Tragic 7.7% |
| Cajuns | 0.0 /100 | #331 | Tragic 7.8% |
| Menominee | 0.0 /100 | #332 | Tragic 7.8% |
| Cherokee | 0.0 /100 | #333 | Tragic 7.9% |
| Yuman | 0.0 /100 | #334 | Tragic 7.9% |
| Chickasaw | 0.0 /100 | #335 | Tragic 8.0% |
| Seminole | 0.0 /100 | #336 | Tragic 8.0% |
Demographics Similar to Salvadorans by Ambulatory Disability
In terms of ambulatory disability, the demographic groups most similar to Salvadorans are Immigrants from El Salvador (5.8%, a difference of 0.020%), Immigrants from Somalia (5.8%, a difference of 0.040%), Kenyan (5.8%, a difference of 0.060%), Immigrants from Lebanon (5.8%, a difference of 0.070%), and Immigrants from Northern Europe (5.8%, a difference of 0.15%).
| Demographics | Rating | Rank | Ambulatory Disability |
| Bhutanese | 98.8 /100 | #89 | Exceptional 5.8% |
| Australians | 98.8 /100 | #90 | Exceptional 5.8% |
| Immigrants | Sudan | 98.8 /100 | #91 | Exceptional 5.8% |
| Immigrants | Sierra Leone | 98.6 /100 | #92 | Exceptional 5.8% |
| Immigrants | Denmark | 98.6 /100 | #93 | Exceptional 5.8% |
| Kenyans | 98.4 /100 | #94 | Exceptional 5.8% |
| Immigrants | El Salvador | 98.4 /100 | #95 | Exceptional 5.8% |
| Salvadorans | 98.4 /100 | #96 | Exceptional 5.8% |
| Immigrants | Somalia | 98.3 /100 | #97 | Exceptional 5.8% |
| Immigrants | Lebanon | 98.3 /100 | #98 | Exceptional 5.8% |
| Immigrants | Northern Europe | 98.2 /100 | #99 | Exceptional 5.8% |
| Immigrants | Serbia | 97.9 /100 | #100 | Exceptional 5.8% |
| Immigrants | South America | 97.9 /100 | #101 | Exceptional 5.8% |
| Immigrants | Kenya | 97.8 /100 | #102 | Exceptional 5.8% |
| Immigrants | Romania | 97.7 /100 | #103 | Exceptional 5.8% |