Pueblo vs Immigrants from Central America Disability Age Over 75
COMPARE
Pueblo
Immigrants from Central America
Disability Age Over 75
Disability Age Over 75 Comparison
Pueblo
Immigrants from Central America
55.9%
DISABILITY AGE OVER 75
0.0/ 100
METRIC RATING
340th/ 347
METRIC RANK
50.5%
DISABILITY AGE OVER 75
0.0/ 100
METRIC RATING
306th/ 347
METRIC RANK
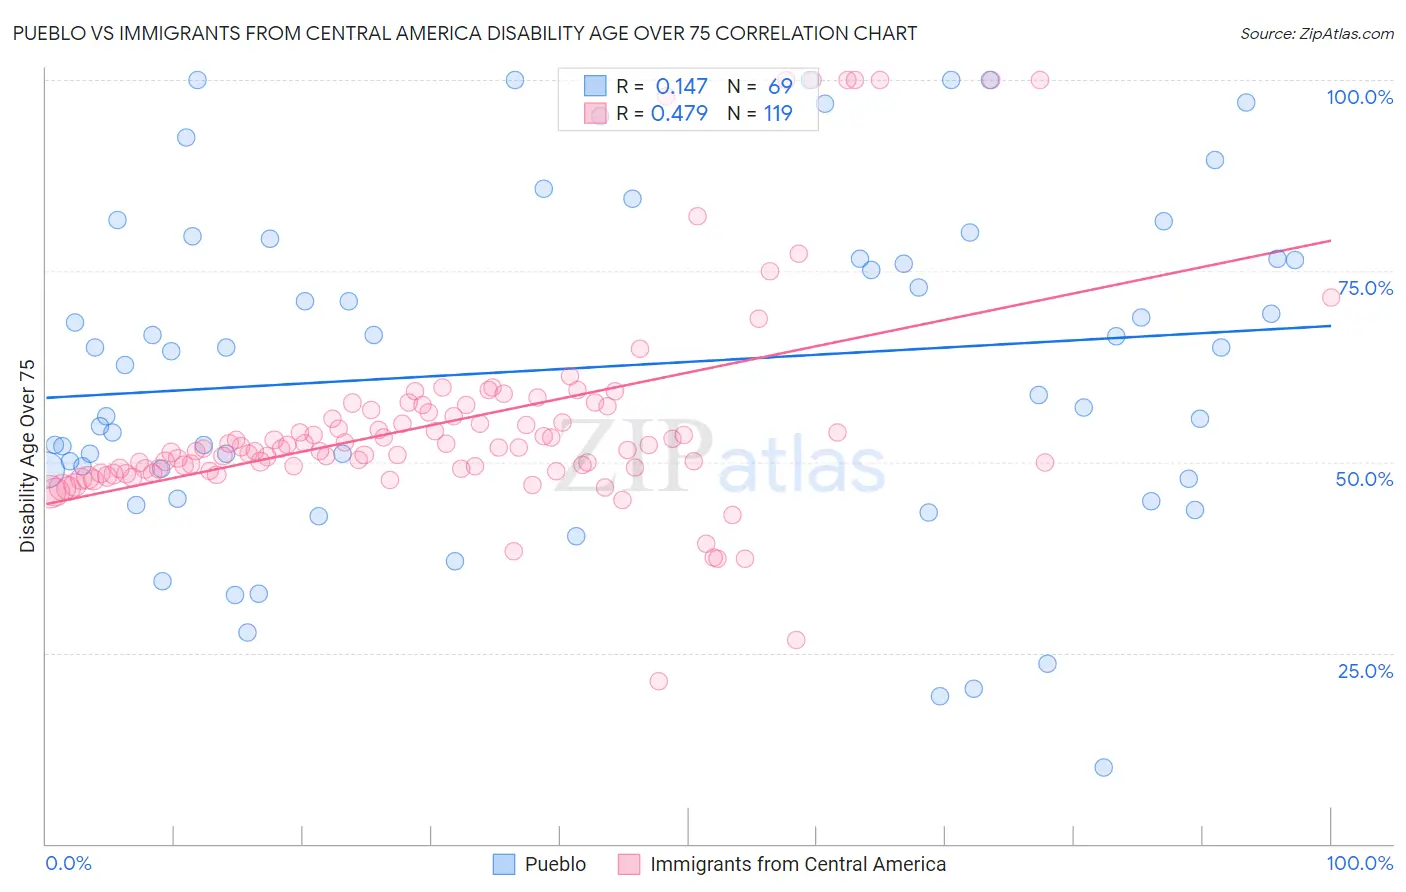
Pueblo vs Immigrants from Central America Disability Age Over 75 Correlation Chart
The statistical analysis conducted on geographies consisting of 119,996,484 people shows a poor positive correlation between the proportion of Pueblo and percentage of population with a disability over the age of 75 in the United States with a correlation coefficient (R) of 0.147 and weighted average of 55.9%. Similarly, the statistical analysis conducted on geographies consisting of 534,859,975 people shows a moderate positive correlation between the proportion of Immigrants from Central America and percentage of population with a disability over the age of 75 in the United States with a correlation coefficient (R) of 0.479 and weighted average of 50.5%, a difference of 10.5%.
Disability Age Over 75 Correlation Summary
| Measurement | Pueblo | Immigrants from Central America |
| Minimum | 10.0% | 21.2% |
| Maximum | 100.0% | 100.0% |
| Range | 90.0% | 78.8% |
| Mean | 62.3% | 55.2% |
| Median | 64.5% | 51.7% |
| Interquartile 25% (IQ1) | 48.4% | 49.0% |
| Interquartile 75% (IQ3) | 77.9% | 56.7% |
| Interquartile Range (IQR) | 29.5% | 7.7% |
| Standard Deviation (Sample) | 22.0% | 14.3% |
| Standard Deviation (Population) | 21.8% | 14.2% |
Similar Demographics by Disability Age Over 75
Demographics Similar to Pueblo by Disability Age Over 75
In terms of disability age over 75, the demographic groups most similar to Pueblo are Pima (55.8%, a difference of 0.080%), Houma (56.2%, a difference of 0.51%), Lumbee (56.2%, a difference of 0.67%), Colville (55.4%, a difference of 0.90%), and Tohono O'odham (56.7%, a difference of 1.5%).
| Demographics | Rating | Rank | Disability Age Over 75 |
| Apache | 0.0 /100 | #333 | Tragic 53.6% |
| Alaskan Athabascans | 0.0 /100 | #334 | Tragic 54.0% |
| Kiowa | 0.0 /100 | #335 | Tragic 54.2% |
| Immigrants | Armenia | 0.0 /100 | #336 | Tragic 54.3% |
| Yuman | 0.0 /100 | #337 | Tragic 54.4% |
| Colville | 0.0 /100 | #338 | Tragic 55.4% |
| Pima | 0.0 /100 | #339 | Tragic 55.8% |
| Pueblo | 0.0 /100 | #340 | Tragic 55.9% |
| Houma | 0.0 /100 | #341 | Tragic 56.2% |
| Lumbee | 0.0 /100 | #342 | Tragic 56.2% |
| Tohono O'odham | 0.0 /100 | #343 | Tragic 56.7% |
| Navajo | 0.0 /100 | #344 | Tragic 58.3% |
| Inupiat | 0.0 /100 | #345 | Tragic 58.4% |
| Tsimshian | 0.0 /100 | #346 | Tragic 59.2% |
| Yup'ik | 0.0 /100 | #347 | Tragic 61.1% |
Demographics Similar to Immigrants from Central America by Disability Age Over 75
In terms of disability age over 75, the demographic groups most similar to Immigrants from Central America are Immigrants from Fiji (50.6%, a difference of 0.060%), Hispanic or Latino (50.6%, a difference of 0.080%), Aleut (50.6%, a difference of 0.080%), Central American Indian (50.5%, a difference of 0.090%), and Tlingit-Haida (50.6%, a difference of 0.12%).
| Demographics | Rating | Rank | Disability Age Over 75 |
| Immigrants | Micronesia | 0.0 /100 | #299 | Tragic 50.1% |
| Cape Verdeans | 0.0 /100 | #300 | Tragic 50.1% |
| Dominicans | 0.0 /100 | #301 | Tragic 50.2% |
| Cherokee | 0.0 /100 | #302 | Tragic 50.2% |
| Japanese | 0.0 /100 | #303 | Tragic 50.2% |
| Immigrants | Dominican Republic | 0.0 /100 | #304 | Tragic 50.3% |
| Central American Indians | 0.0 /100 | #305 | Tragic 50.5% |
| Immigrants | Central America | 0.0 /100 | #306 | Tragic 50.5% |
| Immigrants | Fiji | 0.0 /100 | #307 | Tragic 50.6% |
| Hispanics or Latinos | 0.0 /100 | #308 | Tragic 50.6% |
| Aleuts | 0.0 /100 | #309 | Tragic 50.6% |
| Tlingit-Haida | 0.0 /100 | #310 | Tragic 50.6% |
| Cajuns | 0.0 /100 | #311 | Tragic 50.7% |
| Cheyenne | 0.0 /100 | #312 | Tragic 50.9% |
| Immigrants | Azores | 0.0 /100 | #313 | Tragic 50.9% |