Pueblo vs Assyrian/Chaldean/Syriac Disability Age 65 to 74
COMPARE
Pueblo
Assyrian/Chaldean/Syriac
Disability Age 65 to 74
Disability Age 65 to 74 Comparison
Pueblo
Assyrians/Chaldeans/Syriacs
33.1%
DISABILITY AGE 65 TO 74
0.0/ 100
METRIC RATING
342nd/ 347
METRIC RANK
23.4%
DISABILITY AGE 65 TO 74
45.3/ 100
METRIC RATING
181st/ 347
METRIC RANK
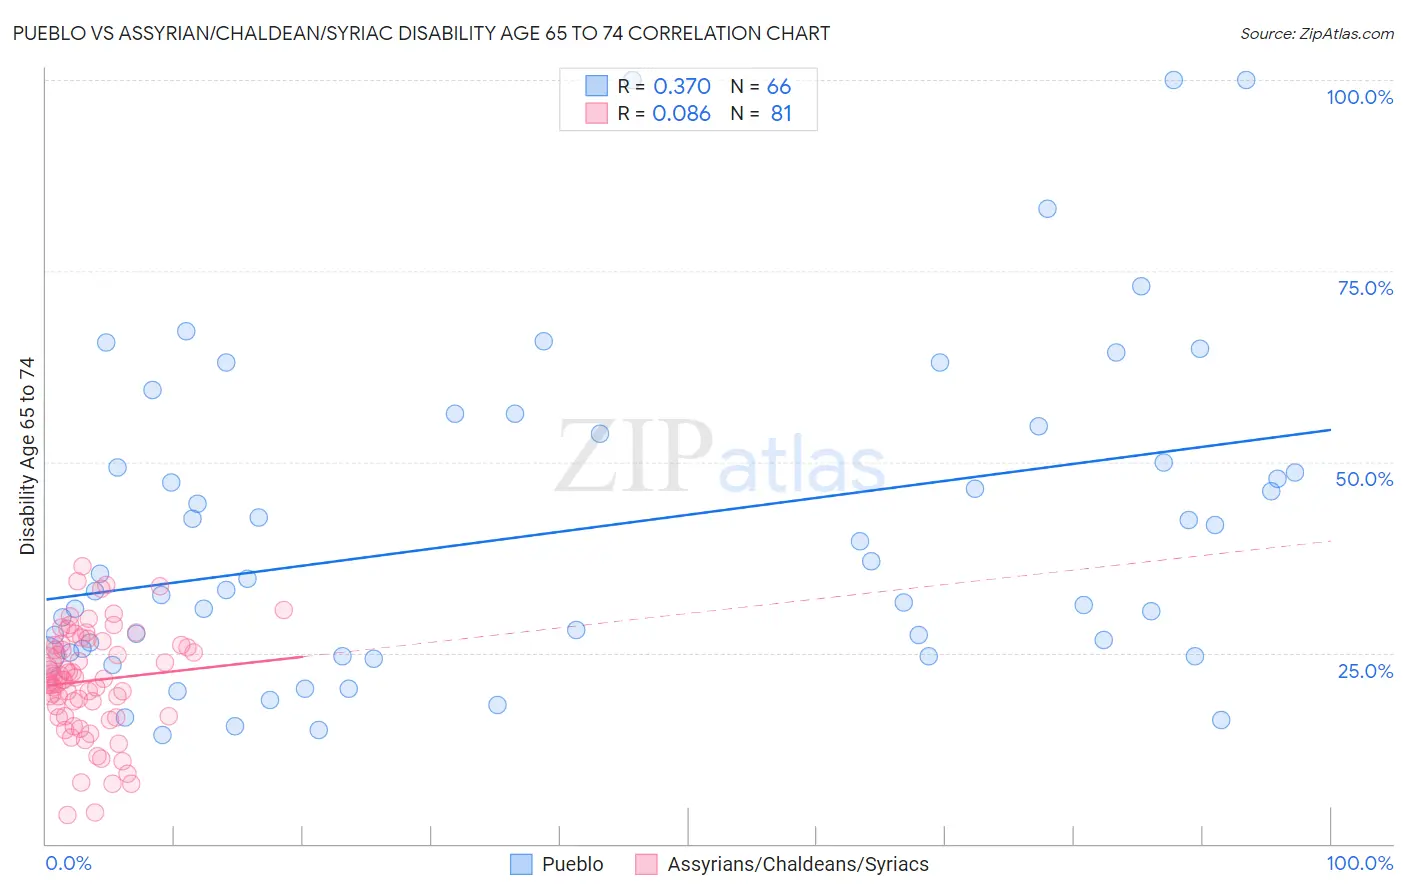
Pueblo vs Assyrian/Chaldean/Syriac Disability Age 65 to 74 Correlation Chart
The statistical analysis conducted on geographies consisting of 120,013,709 people shows a mild positive correlation between the proportion of Pueblo and percentage of population with a disability between the ages 65 and 75 in the United States with a correlation coefficient (R) of 0.370 and weighted average of 33.1%. Similarly, the statistical analysis conducted on geographies consisting of 110,230,384 people shows a slight positive correlation between the proportion of Assyrians/Chaldeans/Syriacs and percentage of population with a disability between the ages 65 and 75 in the United States with a correlation coefficient (R) of 0.086 and weighted average of 23.4%, a difference of 41.4%.
Disability Age 65 to 74 Correlation Summary
| Measurement | Pueblo | Assyrian/Chaldean/Syriac |
| Minimum | 14.3% | 3.8% |
| Maximum | 100.0% | 36.4% |
| Range | 85.7% | 32.6% |
| Mean | 41.0% | 21.3% |
| Median | 34.0% | 21.7% |
| Interquartile 25% (IQ1) | 25.1% | 16.7% |
| Interquartile 75% (IQ3) | 53.7% | 26.1% |
| Interquartile Range (IQR) | 28.6% | 9.4% |
| Standard Deviation (Sample) | 21.0% | 7.0% |
| Standard Deviation (Population) | 20.8% | 6.9% |
Similar Demographics by Disability Age 65 to 74
Demographics Similar to Pueblo by Disability Age 65 to 74
In terms of disability age 65 to 74, the demographic groups most similar to Pueblo are Tsimshian (32.9%, a difference of 0.60%), Navajo (33.3%, a difference of 0.72%), Lumbee (32.7%, a difference of 1.1%), Kiowa (32.6%, a difference of 1.7%), and Alaskan Athabascan (32.4%, a difference of 2.3%).
| Demographics | Rating | Rank | Disability Age 65 to 74 |
| Colville | 0.0 /100 | #333 | Tragic 30.5% |
| Alaska Natives | 0.0 /100 | #334 | Tragic 30.6% |
| Cheyenne | 0.0 /100 | #335 | Tragic 31.1% |
| Yuman | 0.0 /100 | #336 | Tragic 31.5% |
| Houma | 0.0 /100 | #337 | Tragic 32.3% |
| Alaskan Athabascans | 0.0 /100 | #338 | Tragic 32.4% |
| Kiowa | 0.0 /100 | #339 | Tragic 32.6% |
| Lumbee | 0.0 /100 | #340 | Tragic 32.7% |
| Tsimshian | 0.0 /100 | #341 | Tragic 32.9% |
| Pueblo | 0.0 /100 | #342 | Tragic 33.1% |
| Navajo | 0.0 /100 | #343 | Tragic 33.3% |
| Inupiat | 0.0 /100 | #344 | Tragic 34.5% |
| Tohono O'odham | 0.0 /100 | #345 | Tragic 36.0% |
| Yup'ik | 0.0 /100 | #346 | Tragic 37.8% |
| Pima | 0.0 /100 | #347 | Tragic 38.6% |
Demographics Similar to Assyrians/Chaldeans/Syriacs by Disability Age 65 to 74
In terms of disability age 65 to 74, the demographic groups most similar to Assyrians/Chaldeans/Syriacs are Scandinavian (23.4%, a difference of 0.010%), Guyanese (23.4%, a difference of 0.030%), Immigrants from Sierra Leone (23.4%, a difference of 0.030%), Irish (23.4%, a difference of 0.060%), and Immigrants from Eritrea (23.4%, a difference of 0.13%).
| Demographics | Rating | Rank | Disability Age 65 to 74 |
| Immigrants | South Eastern Asia | 50.0 /100 | #174 | Average 23.3% |
| Dutch | 49.4 /100 | #175 | Average 23.3% |
| Immigrants | Eritrea | 47.5 /100 | #176 | Average 23.4% |
| Immigrants | Haiti | 47.5 /100 | #177 | Average 23.4% |
| Guyanese | 45.8 /100 | #178 | Average 23.4% |
| Immigrants | Sierra Leone | 45.8 /100 | #179 | Average 23.4% |
| Scandinavians | 45.6 /100 | #180 | Average 23.4% |
| Assyrians/Chaldeans/Syriacs | 45.3 /100 | #181 | Average 23.4% |
| Irish | 44.4 /100 | #182 | Average 23.4% |
| Immigrants | Eastern Africa | 42.8 /100 | #183 | Average 23.4% |
| Immigrants | Germany | 42.5 /100 | #184 | Average 23.4% |
| Haitians | 42.4 /100 | #185 | Average 23.4% |
| Basques | 38.4 /100 | #186 | Fair 23.5% |
| Portuguese | 37.8 /100 | #187 | Fair 23.5% |
| Immigrants | Cuba | 34.0 /100 | #188 | Fair 23.6% |