Potawatomi vs Immigrants from Africa Disability Age Over 75
COMPARE
Potawatomi
Immigrants from Africa
Disability Age Over 75
Disability Age Over 75 Comparison
Potawatomi
Immigrants from Africa
49.0%
DISABILITY AGE OVER 75
0.2/ 100
METRIC RATING
270th/ 347
METRIC RANK
47.3%
DISABILITY AGE OVER 75
53.6/ 100
METRIC RATING
171st/ 347
METRIC RANK
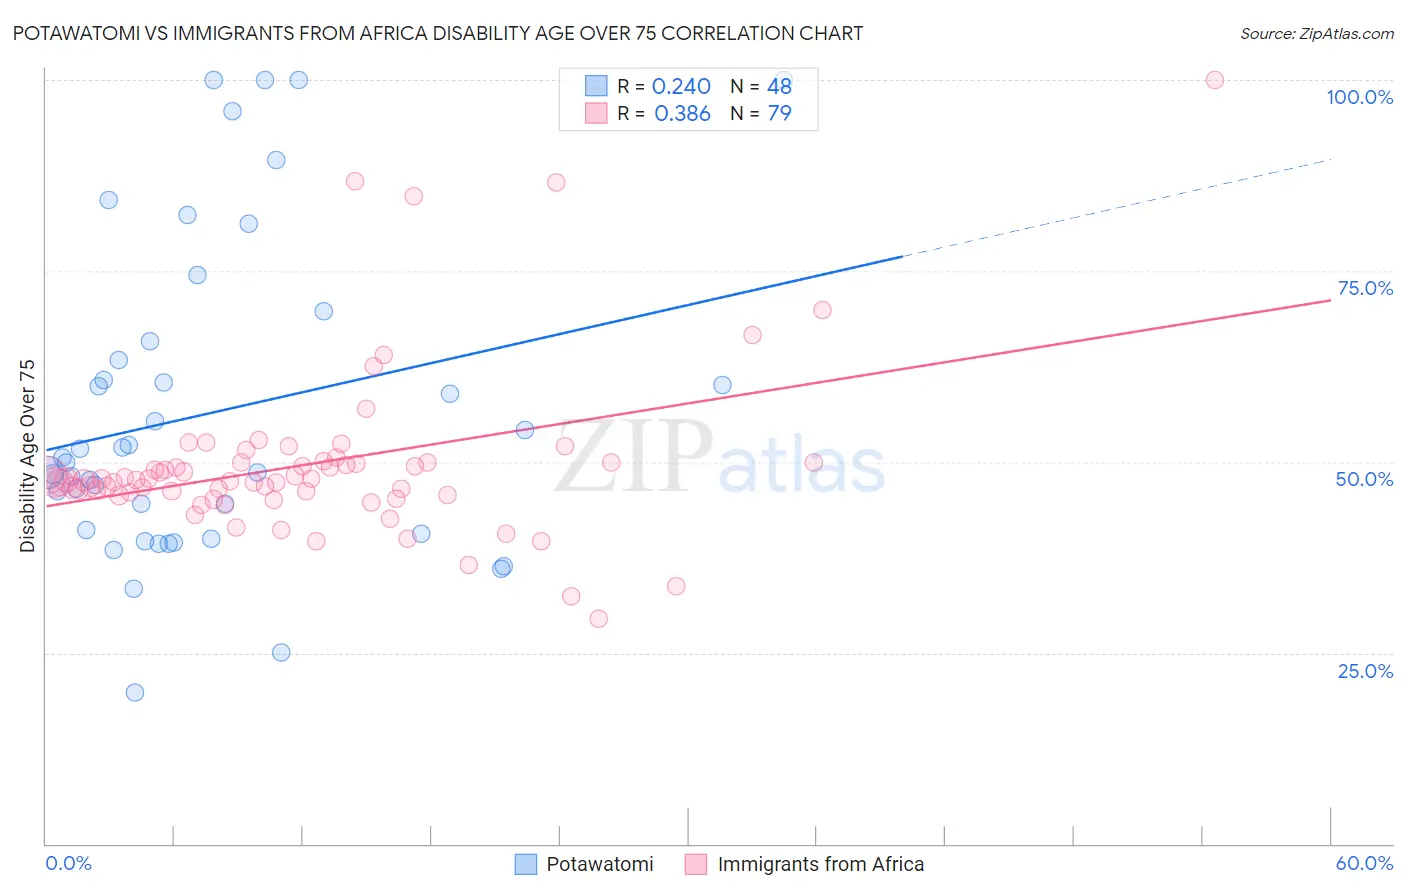
Potawatomi vs Immigrants from Africa Disability Age Over 75 Correlation Chart
The statistical analysis conducted on geographies consisting of 117,704,790 people shows a weak positive correlation between the proportion of Potawatomi and percentage of population with a disability over the age of 75 in the United States with a correlation coefficient (R) of 0.240 and weighted average of 49.0%. Similarly, the statistical analysis conducted on geographies consisting of 468,103,212 people shows a mild positive correlation between the proportion of Immigrants from Africa and percentage of population with a disability over the age of 75 in the United States with a correlation coefficient (R) of 0.386 and weighted average of 47.3%, a difference of 3.7%.
Disability Age Over 75 Correlation Summary
| Measurement | Potawatomi | Immigrants from Africa |
| Minimum | 19.8% | 29.5% |
| Maximum | 100.0% | 100.0% |
| Range | 80.2% | 70.5% |
| Mean | 56.5% | 49.7% |
| Median | 50.3% | 47.6% |
| Interquartile 25% (IQ1) | 40.8% | 45.6% |
| Interquartile 75% (IQ3) | 64.6% | 50.0% |
| Interquartile Range (IQR) | 23.8% | 4.4% |
| Standard Deviation (Sample) | 20.6% | 11.2% |
| Standard Deviation (Population) | 20.4% | 11.1% |
Similar Demographics by Disability Age Over 75
Demographics Similar to Potawatomi by Disability Age Over 75
In terms of disability age over 75, the demographic groups most similar to Potawatomi are Fijian (49.0%, a difference of 0.020%), Immigrants from El Salvador (49.0%, a difference of 0.030%), Assyrian/Chaldean/Syriac (49.1%, a difference of 0.030%), Guatemalan (49.0%, a difference of 0.050%), and Malaysian (49.0%, a difference of 0.060%).
| Demographics | Rating | Rank | Disability Age Over 75 |
| Salvadorans | 0.3 /100 | #263 | Tragic 48.9% |
| Immigrants | Honduras | 0.3 /100 | #264 | Tragic 48.9% |
| Hondurans | 0.3 /100 | #265 | Tragic 48.9% |
| U.S. Virgin Islanders | 0.2 /100 | #266 | Tragic 48.9% |
| Malaysians | 0.2 /100 | #267 | Tragic 49.0% |
| Guatemalans | 0.2 /100 | #268 | Tragic 49.0% |
| Immigrants | El Salvador | 0.2 /100 | #269 | Tragic 49.0% |
| Potawatomi | 0.2 /100 | #270 | Tragic 49.0% |
| Fijians | 0.2 /100 | #271 | Tragic 49.0% |
| Assyrians/Chaldeans/Syriacs | 0.2 /100 | #272 | Tragic 49.1% |
| Immigrants | Iraq | 0.1 /100 | #273 | Tragic 49.1% |
| Immigrants | Guatemala | 0.1 /100 | #274 | Tragic 49.1% |
| Immigrants | Dominica | 0.1 /100 | #275 | Tragic 49.1% |
| Immigrants | Uzbekistan | 0.1 /100 | #276 | Tragic 49.2% |
| Hawaiians | 0.1 /100 | #277 | Tragic 49.2% |
Demographics Similar to Immigrants from Africa by Disability Age Over 75
In terms of disability age over 75, the demographic groups most similar to Immigrants from Africa are Scotch-Irish (47.3%, a difference of 0.030%), Alsatian (47.3%, a difference of 0.040%), German Russian (47.3%, a difference of 0.060%), White/Caucasian (47.3%, a difference of 0.080%), and Immigrants from Haiti (47.3%, a difference of 0.090%).
| Demographics | Rating | Rank | Disability Age Over 75 |
| French | 64.6 /100 | #164 | Good 47.2% |
| Immigrants | Zimbabwe | 64.4 /100 | #165 | Good 47.2% |
| Immigrants | Sierra Leone | 64.4 /100 | #166 | Good 47.2% |
| Moroccans | 62.9 /100 | #167 | Good 47.2% |
| Kenyans | 58.8 /100 | #168 | Average 47.2% |
| Celtics | 58.7 /100 | #169 | Average 47.2% |
| German Russians | 56.2 /100 | #170 | Average 47.3% |
| Immigrants | Africa | 53.6 /100 | #171 | Average 47.3% |
| Scotch-Irish | 52.5 /100 | #172 | Average 47.3% |
| Alsatians | 51.9 /100 | #173 | Average 47.3% |
| Whites/Caucasians | 50.0 /100 | #174 | Average 47.3% |
| Immigrants | Haiti | 49.7 /100 | #175 | Average 47.3% |
| Ecuadorians | 46.7 /100 | #176 | Average 47.4% |
| Haitians | 44.6 /100 | #177 | Average 47.4% |
| Cubans | 42.1 /100 | #178 | Average 47.4% |