Polish vs Carpatho Rusyn Disability Age 65 to 74
COMPARE
Polish
Carpatho Rusyn
Disability Age 65 to 74
Disability Age 65 to 74 Comparison
Poles
Carpatho Rusyns
22.0%
DISABILITY AGE 65 TO 74
97.8/ 100
METRIC RATING
92nd/ 347
METRIC RANK
21.6%
DISABILITY AGE 65 TO 74
99.5/ 100
METRIC RATING
62nd/ 347
METRIC RANK
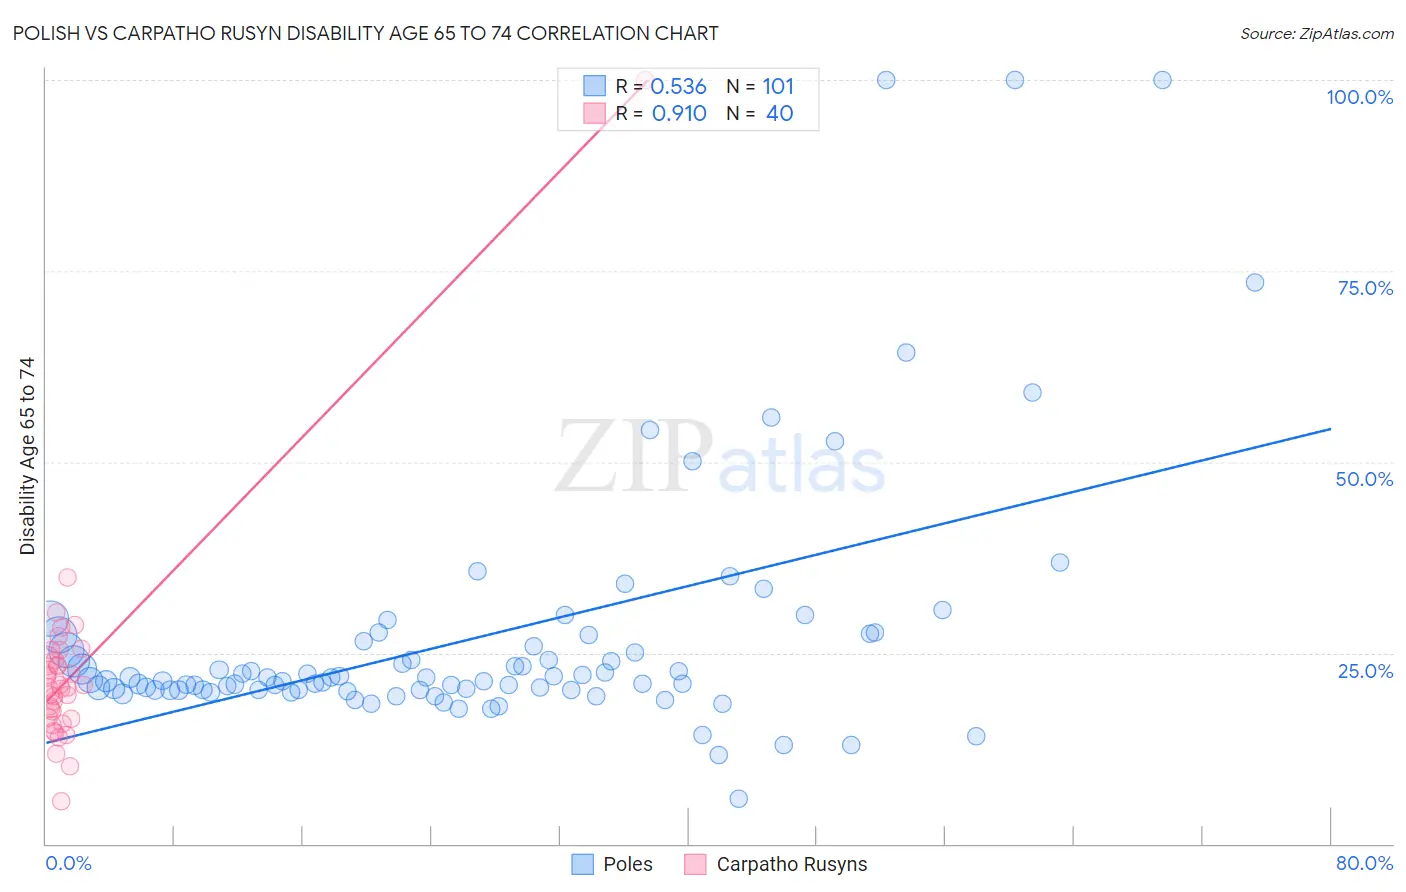
Polish vs Carpatho Rusyn Disability Age 65 to 74 Correlation Chart
The statistical analysis conducted on geographies consisting of 558,217,001 people shows a substantial positive correlation between the proportion of Poles and percentage of population with a disability between the ages 65 and 75 in the United States with a correlation coefficient (R) of 0.536 and weighted average of 22.0%. Similarly, the statistical analysis conducted on geographies consisting of 58,867,646 people shows a near-perfect positive correlation between the proportion of Carpatho Rusyns and percentage of population with a disability between the ages 65 and 75 in the United States with a correlation coefficient (R) of 0.910 and weighted average of 21.6%, a difference of 2.2%.
Disability Age 65 to 74 Correlation Summary
| Measurement | Polish | Carpatho Rusyn |
| Minimum | 5.9% | 5.6% |
| Maximum | 100.0% | 100.0% |
| Range | 94.1% | 94.4% |
| Mean | 27.0% | 22.3% |
| Median | 21.5% | 20.5% |
| Interquartile 25% (IQ1) | 20.2% | 16.5% |
| Interquartile 75% (IQ3) | 26.9% | 24.0% |
| Interquartile Range (IQR) | 6.7% | 7.6% |
| Standard Deviation (Sample) | 16.6% | 13.8% |
| Standard Deviation (Population) | 16.6% | 13.7% |
Similar Demographics by Disability Age 65 to 74
Demographics Similar to Poles by Disability Age 65 to 74
In terms of disability age 65 to 74, the demographic groups most similar to Poles are Immigrants from Canada (22.1%, a difference of 0.030%), Immigrants from Chile (22.1%, a difference of 0.050%), Chilean (22.0%, a difference of 0.060%), Italian (22.0%, a difference of 0.070%), and Immigrants from Kuwait (22.0%, a difference of 0.080%).
| Demographics | Rating | Rank | Disability Age 65 to 74 |
| Immigrants | Lebanon | 98.4 /100 | #85 | Exceptional 21.9% |
| South Africans | 98.4 /100 | #86 | Exceptional 21.9% |
| Australians | 98.0 /100 | #87 | Exceptional 22.0% |
| Immigrants | Netherlands | 97.9 /100 | #88 | Exceptional 22.0% |
| Immigrants | Kuwait | 97.9 /100 | #89 | Exceptional 22.0% |
| Italians | 97.9 /100 | #90 | Exceptional 22.0% |
| Chileans | 97.9 /100 | #91 | Exceptional 22.0% |
| Poles | 97.8 /100 | #92 | Exceptional 22.0% |
| Immigrants | Canada | 97.8 /100 | #93 | Exceptional 22.1% |
| Immigrants | Chile | 97.7 /100 | #94 | Exceptional 22.1% |
| Romanians | 97.7 /100 | #95 | Exceptional 22.1% |
| Immigrants | North America | 97.5 /100 | #96 | Exceptional 22.1% |
| Immigrants | Southern Europe | 97.2 /100 | #97 | Exceptional 22.1% |
| Jordanians | 96.9 /100 | #98 | Exceptional 22.2% |
| Immigrants | Colombia | 96.8 /100 | #99 | Exceptional 22.2% |
Demographics Similar to Carpatho Rusyns by Disability Age 65 to 74
In terms of disability age 65 to 74, the demographic groups most similar to Carpatho Rusyns are Egyptian (21.6%, a difference of 0.030%), Immigrants from North Macedonia (21.6%, a difference of 0.050%), Zimbabwean (21.5%, a difference of 0.080%), Immigrants from Europe (21.6%, a difference of 0.10%), and Immigrants from Pakistan (21.5%, a difference of 0.11%).
| Demographics | Rating | Rank | Disability Age 65 to 74 |
| Immigrants | Romania | 99.5 /100 | #55 | Exceptional 21.5% |
| Immigrants | Denmark | 99.5 /100 | #56 | Exceptional 21.5% |
| Immigrants | Asia | 99.5 /100 | #57 | Exceptional 21.5% |
| Immigrants | Pakistan | 99.5 /100 | #58 | Exceptional 21.5% |
| Zimbabweans | 99.5 /100 | #59 | Exceptional 21.5% |
| Immigrants | North Macedonia | 99.5 /100 | #60 | Exceptional 21.6% |
| Egyptians | 99.5 /100 | #61 | Exceptional 21.6% |
| Carpatho Rusyns | 99.5 /100 | #62 | Exceptional 21.6% |
| Immigrants | Europe | 99.4 /100 | #63 | Exceptional 21.6% |
| Immigrants | Latvia | 99.4 /100 | #64 | Exceptional 21.6% |
| Immigrants | Russia | 99.4 /100 | #65 | Exceptional 21.6% |
| Maltese | 99.4 /100 | #66 | Exceptional 21.6% |
| Immigrants | South Africa | 99.3 /100 | #67 | Exceptional 21.7% |
| Immigrants | Scotland | 99.3 /100 | #68 | Exceptional 21.7% |
| Immigrants | Egypt | 99.2 /100 | #69 | Exceptional 21.7% |