Peruvian vs Mexican Disability Age 18 to 34

COMPARE

Peruvian
Race
Ancestry
AfghanAfricanAlaska NativeAlaskan AthabascanAlbanianAleutAlsatianAmericanApacheArabArapahoArgentineanArmenianAssyrian/Chaldean/SyriacAustralianAustrianBahamianBangladeshiBarbadianBasqueBelgianBelizeanBermudanBhutaneseBlackfeetBolivianBrazilianBritishBritish West IndianBulgarianBurmeseCajunCambodianCanadianCape VerdeanCarpatho RusynCelticCentral AmericanCentral American IndianCherokeeCheyenneChickasawChileanChineseChippewaChoctawColombianColvilleComancheCosta RicanCreeCreekCroatianCrowCubanCypriotCzechCzechoslovakianDanishDelawareDominicanDutchDutch West IndianEastern EuropeanEcuadorianEgyptianEnglishEstonianEthiopianEuropeanFijianFilipinoFinnishFrenchFrench American IndianFrench CanadianGermanGerman RussianGhanaianGreekGuamanian/ChamorroGuatemalanGuyaneseHaitianHmongHonduranHopiHoumaHungarianIcelanderIndian (Asian)IndonesianInupiatIranianIraqiIrishIroquoisIsraeliItalianJamaicanJapaneseJordanianKenyanKiowaKoreanLaotianLatvianLebaneseLiberianLithuanianLumbeeLuxembourgerMacedonianMalaysianMalteseMarshalleseMenomineeMexican American IndianMongolianMoroccanNative HawaiianNavajoNepaleseNew ZealanderNicaraguanNigerianNorthern EuropeanNorwegianOkinawanOsageOttawaPaiutePakistaniPalestinianPanamanianParaguayanPennsylvania GermanPeruvianPimaPolishPortuguesePotawatomiPuebloPuerto RicanPuget Sound SalishRomanianRussianSalvadoranSamoanScandinavianScotch-IrishScottishSeminoleSenegaleseSerbianShoshoneSierra LeoneanSiouxSlavicSlovakSloveneSomaliSouth AfricanSouth AmericanSouth American IndianSoviet UnionSpaniardSpanishSpanish AmericanSpanish American IndianSri LankanSubsaharan AfricanSudaneseSwedishSwissSyrianTaiwaneseThaiTlingit-HaidaTohono O'OdhamTonganTrinidadian and TobagonianTsimshianTurkishU.S. Virgin IslanderUgandanUkrainianUruguayanUteVenezuelanVietnameseWelshWest IndianYakamaYaquiYugoslavianYumanYup'ikZimbabwean
Immigration
NonimmigrantsImmigrantsAfghanistanAfricaAlbaniaArgentinaArmeniaAsiaAustraliaAustriaBahamasBangladeshBarbadosBelarusBelgiumBelizeBoliviaBosnia and HerzegovinaBrazilBulgariaBurma/MyanmarCabo VerdeCambodiaCameroonCanadaCaribbeanCentral AmericaChileChinaColombiaCongoCosta RicaCroatiaCubaCzechoslovakiaDenmarkDominicaDominican RepublicEastern AfricaEastern AsiaEastern EuropeEcuadorEgyptEl SalvadorEnglandEritreaEthiopiaEuropeFijiFranceGermanyGhanaGreeceGrenadaGuatemalaGuyanaHaitiHondurasHong KongHungaryIndiaIndonesiaIranIraqIrelandIsraelItalyJamaicaJapanJordanKazakhstanKenyaKoreaKuwaitLaosLatin AmericaLatviaLebanonLiberiaLithuaniaMalaysiaMexicoMicronesiaMiddle AfricaMoldovaMoroccoNepalNetherlandsNicaraguaNigeriaNorth AmericaNorth MacedoniaNorthern AfricaNorthern EuropeNorwayOceaniaPakistanPanamaPeruPhilippinesPolandPortugalRomaniaRussiaSaudi ArabiaScotlandSenegalSerbiaSierra LeoneSingaporeSomaliaSouth AfricaSouth AmericaSouth Central AsiaSouth Eastern AsiaSouthern EuropeSpainSri LankaSt. Vincent and the GrenadinesSudanSwedenSwitzerlandSyriaTaiwanThailandTrinidad and TobagoTurkeyUgandaUkraineUruguayUzbekistanVenezuelaVietnamWest IndiesWestern AfricaWestern AsiaWestern EuropeYemenZaireZimbabweAzores
Mexican
Race
Ancestry
AfghanAfricanAlaska NativeAlaskan AthabascanAlbanianAleutAlsatianAmericanApacheArabArapahoArgentineanArmenianAssyrian/Chaldean/SyriacAustralianAustrianBahamianBangladeshiBarbadianBasqueBelgianBelizeanBermudanBhutaneseBlackfeetBolivianBrazilianBritishBritish West IndianBulgarianBurmeseCajunCambodianCanadianCape VerdeanCarpatho RusynCelticCentral AmericanCentral American IndianCherokeeCheyenneChickasawChileanChineseChippewaChoctawColombianColvilleComancheCosta RicanCreeCreekCroatianCrowCubanCypriotCzechCzechoslovakianDanishDelawareDominicanDutchDutch West IndianEastern EuropeanEcuadorianEgyptianEnglishEstonianEthiopianEuropeanFijianFilipinoFinnishFrenchFrench American IndianFrench CanadianGermanGerman RussianGhanaianGreekGuamanian/ChamorroGuatemalanGuyaneseHaitianHmongHonduranHopiHoumaHungarianIcelanderIndian (Asian)IndonesianInupiatIranianIraqiIrishIroquoisIsraeliItalianJamaicanJapaneseJordanianKenyanKiowaKoreanLaotianLatvianLebaneseLiberianLithuanianLumbeeLuxembourgerMacedonianMalaysianMalteseMarshalleseMenomineeMexicanMexican American IndianMongolianMoroccanNative HawaiianNavajoNepaleseNew ZealanderNicaraguanNigerianNorthern EuropeanNorwegianOkinawanOsageOttawaPaiutePakistaniPalestinianPanamanianParaguayanPennsylvania GermanPimaPolishPortuguesePotawatomiPuebloPuerto RicanPuget Sound SalishRomanianRussianSalvadoranSamoanScandinavianScotch-IrishScottishSeminoleSenegaleseSerbianShoshoneSierra LeoneanSiouxSlavicSlovakSloveneSomaliSouth AfricanSouth AmericanSouth American IndianSoviet UnionSpaniardSpanishSpanish AmericanSpanish American IndianSri LankanSubsaharan AfricanSudaneseSwedishSwissSyrianTaiwaneseThaiTlingit-HaidaTohono O'OdhamTonganTrinidadian and TobagonianTsimshianTurkishU.S. Virgin IslanderUgandanUkrainianUruguayanUteVenezuelanVietnameseWelshWest IndianYakamaYaquiYugoslavianYumanYup'ikZimbabwean
Immigration
NonimmigrantsImmigrantsAfghanistanAfricaAlbaniaArgentinaArmeniaAsiaAustraliaAustriaBahamasBangladeshBarbadosBelarusBelgiumBelizeBoliviaBosnia and HerzegovinaBrazilBulgariaBurma/MyanmarCabo VerdeCambodiaCameroonCanadaCaribbeanCentral AmericaChileChinaColombiaCongoCosta RicaCroatiaCubaCzechoslovakiaDenmarkDominicaDominican RepublicEastern AfricaEastern AsiaEastern EuropeEcuadorEgyptEl SalvadorEnglandEritreaEthiopiaEuropeFijiFranceGermanyGhanaGreeceGrenadaGuatemalaGuyanaHaitiHondurasHong KongHungaryIndiaIndonesiaIranIraqIrelandIsraelItalyJamaicaJapanJordanKazakhstanKenyaKoreaKuwaitLaosLatin AmericaLatviaLebanonLiberiaLithuaniaMalaysiaMexicoMicronesiaMiddle AfricaMoldovaMoroccoNepalNetherlandsNicaraguaNigeriaNorth AmericaNorth MacedoniaNorthern AfricaNorthern EuropeNorwayOceaniaPakistanPanamaPeruPhilippinesPolandPortugalRomaniaRussiaSaudi ArabiaScotlandSenegalSerbiaSierra LeoneSingaporeSomaliaSouth AfricaSouth AmericaSouth Central AsiaSouth Eastern AsiaSouthern EuropeSpainSri LankaSt. Vincent and the GrenadinesSudanSwedenSwitzerlandSyriaTaiwanThailandTrinidad and TobagoTurkeyUgandaUkraineUruguayUzbekistanVenezuelaVietnamWest IndiesWestern AfricaWestern AsiaWestern EuropeYemenZaireZimbabweAzores
Disability Age 18 to 34
Income
Poverty
Unemployment
Labor Participation
Family Structure
Vehicle Availability
Education Level
Disability

Disability Age 18 to 34 Comparison

Peruvians

Mexicans

Exceptional
Poor
6.0%
DISABILITY AGE 18 TO 34
99.6/ 100
METRIC RATING
62nd/ 347
METRIC RANK
6.8%
DISABILITY AGE 18 TO 34
12.6/ 100
METRIC RATING
207th/ 347
METRIC RANK

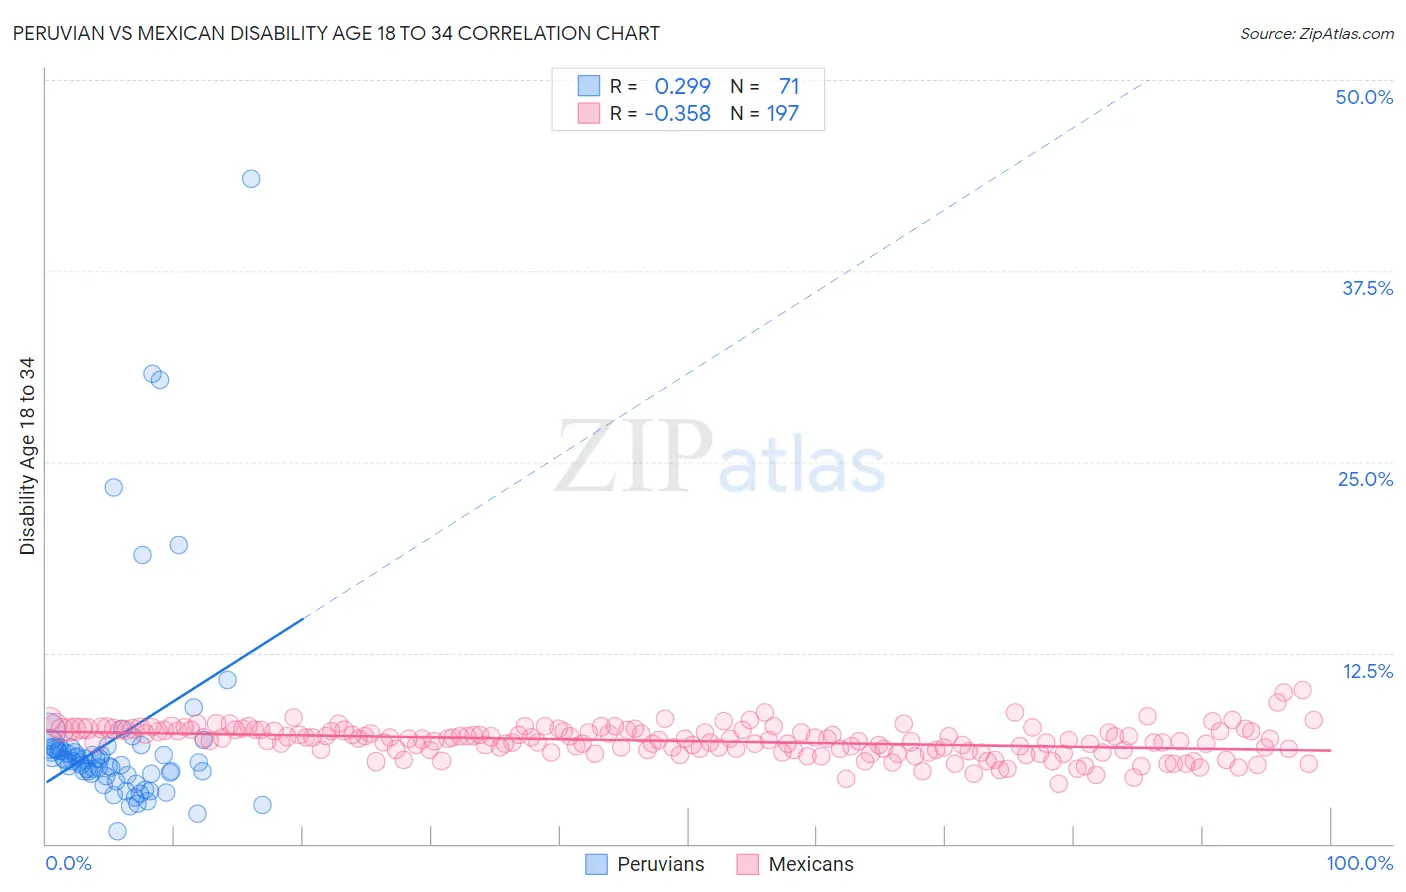
Peruvian vs Mexican Disability Age 18 to 34 Correlation Chart

The statistical analysis conducted on geographies consisting of 362,638,552 people shows a weak positive correlation between the proportion of Peruvians and percentage of population with a disability between the ages 18 and 35 in the United States with a correlation coefficient (R) of 0.299 and weighted average of 6.0%. Similarly, the statistical analysis conducted on geographies consisting of 560,358,303 people shows a mild negative correlation between the proportion of Mexicans and percentage of population with a disability between the ages 18 and 35 in the United States with a correlation coefficient (R) of -0.358 and weighted average of 6.8%, a difference of 14.2%.
Peruvian vs Mexican Disability Age 18 to 34

Disability Age 18 to 34 Correlation Summary

MeasurementPeruvianMexican
Minimum0.85%3.9%
Maximum43.5%10.1%
Range42.7%6.1%
Mean7.0%6.7%
Median5.4%6.9%
Interquartile 25% (IQ1)4.5%6.1%
Interquartile 75% (IQ3)6.3%7.4%
Interquartile Range (IQR)1.8%1.3%
Standard Deviation (Sample)7.0%0.99%
Standard Deviation (Population)6.9%0.99%

Similar Demographics by Disability Age 18 to 34

Demographics Similar to Peruvians by Disability Age 18 to 34

In terms of disability age 18 to 34, the demographic groups most similar to Peruvians are British West Indian (6.0%, a difference of 0.030%), Salvadoran (6.0%, a difference of 0.050%), Taiwanese (6.0%, a difference of 0.070%), Trinidadian and Tobagonian (6.0%, a difference of 0.21%), and Immigrants from Sri Lanka (6.0%, a difference of 0.28%).
DemographicsRating | RankDisability Age 18 to 34
Immigrants | Spain
99.7
/100
|
#55
Exceptional
5.9%
Paraguayans
99.7
/100
|
#56
Exceptional
5.9%
Immigrants | Haiti
99.7
/100
|
#57
Exceptional
5.9%
Immigrants | Serbia
99.7
/100
|
#58
Exceptional
5.9%
Immigrants | Caribbean
99.6
/100
|
#59
Exceptional
6.0%
Immigrants | Sri Lanka
99.6
/100
|
#60
Exceptional
6.0%
British West Indians
99.6
/100
|
#61
Exceptional
6.0%
Peruvians
99.6
/100
|
#62
Exceptional
6.0%
Salvadorans
99.6
/100
|
#63
Exceptional
6.0%
Taiwanese
99.6
/100
|
#64
Exceptional
6.0%
Trinidadians and Tobagonians
99.5
/100
|
#65
Exceptional
6.0%
Burmese
99.5
/100
|
#66
Exceptional
6.0%
Immigrants | North Macedonia
99.5
/100
|
#67
Exceptional
6.0%
Immigrants | Poland
99.5
/100
|
#68
Exceptional
6.0%
Immigrants | West Indies
99.4
/100
|
#69
Exceptional
6.0%

Demographics Similar to Mexicans by Disability Age 18 to 34

In terms of disability age 18 to 34, the demographic groups most similar to Mexicans are Immigrants from Scotland (6.8%, a difference of 0.020%), Japanese (6.8%, a difference of 0.030%), Immigrants from Burma/Myanmar (6.8%, a difference of 0.040%), Lebanese (6.8%, a difference of 0.11%), and Immigrants from Bosnia and Herzegovina (6.8%, a difference of 0.16%).
DemographicsRating | RankDisability Age 18 to 34
Sierra Leoneans
17.5
/100
|
#200
Poor
6.8%
Greeks
16.1
/100
|
#201
Poor
6.8%
Panamanians
15.8
/100
|
#202
Poor
6.8%
Hispanics or Latinos
13.8
/100
|
#203
Poor
6.8%
Immigrants | Bosnia and Herzegovina
13.6
/100
|
#204
Poor
6.8%
Lebanese
13.3
/100
|
#205
Poor
6.8%
Japanese
12.8
/100
|
#206
Poor
6.8%
Mexicans
12.6
/100
|
#207
Poor
6.8%
Immigrants | Scotland
12.4
/100
|
#208
Poor
6.8%
Immigrants | Burma/Myanmar
12.3
/100
|
#209
Poor
6.8%
Latvians
11.1
/100
|
#210
Poor
6.8%
Immigrants | Norway
10.0
/100
|
#211
Tragic
6.8%
Luxembourgers
9.4
/100
|
#212
Tragic
6.9%
Immigrants | Western Europe
9.1
/100
|
#213
Tragic
6.9%
Serbians
8.2
/100
|
#214
Tragic
6.9%