Paraguayan vs Carpatho Rusyn Hearing Disability
COMPARE
Paraguayan
Carpatho Rusyn
Hearing Disability
Hearing Disability Comparison
Paraguayans
Carpatho Rusyns
2.7%
HEARING DISABILITY
99.2/ 100
METRIC RATING
50th/ 347
METRIC RANK
3.4%
HEARING DISABILITY
0.3/ 100
METRIC RATING
253rd/ 347
METRIC RANK
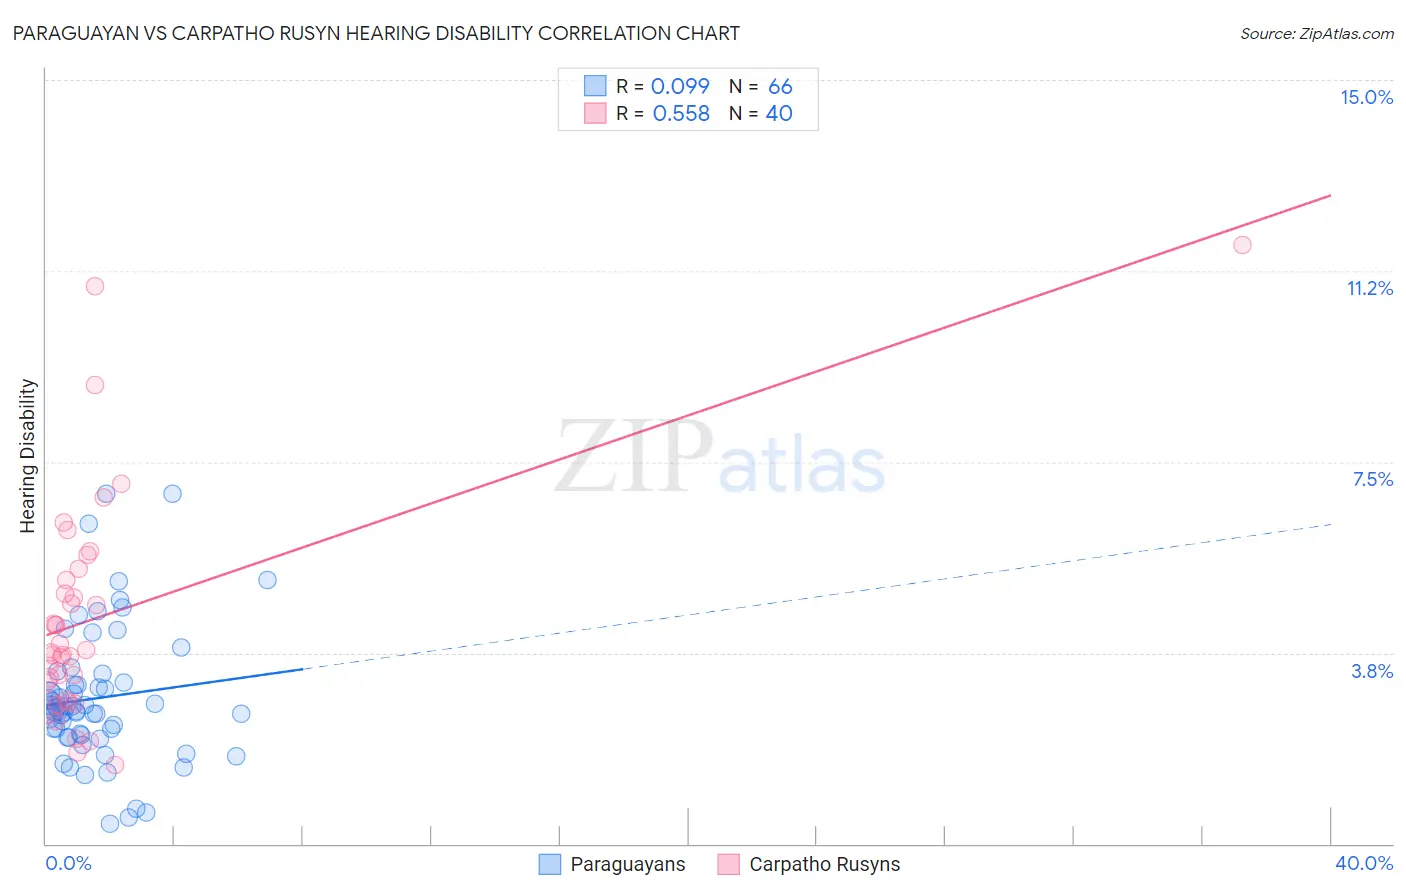
Paraguayan vs Carpatho Rusyn Hearing Disability Correlation Chart
The statistical analysis conducted on geographies consisting of 95,101,593 people shows a slight positive correlation between the proportion of Paraguayans and percentage of population with hearing disability in the United States with a correlation coefficient (R) of 0.099 and weighted average of 2.7%. Similarly, the statistical analysis conducted on geographies consisting of 58,869,507 people shows a substantial positive correlation between the proportion of Carpatho Rusyns and percentage of population with hearing disability in the United States with a correlation coefficient (R) of 0.558 and weighted average of 3.4%, a difference of 28.2%.
Hearing Disability Correlation Summary
| Measurement | Paraguayan | Carpatho Rusyn |
| Minimum | 0.40% | 1.5% |
| Maximum | 6.9% | 11.8% |
| Range | 6.5% | 10.2% |
| Mean | 2.9% | 4.5% |
| Median | 2.6% | 3.8% |
| Interquartile 25% (IQ1) | 2.1% | 3.0% |
| Interquartile 75% (IQ3) | 3.2% | 5.3% |
| Interquartile Range (IQR) | 1.0% | 2.3% |
| Standard Deviation (Sample) | 1.3% | 2.2% |
| Standard Deviation (Population) | 1.3% | 2.2% |
Similar Demographics by Hearing Disability
Demographics Similar to Paraguayans by Hearing Disability
In terms of hearing disability, the demographic groups most similar to Paraguayans are Immigrants from Hong Kong (2.7%, a difference of 0.070%), Immigrants from South America (2.7%, a difference of 0.19%), Immigrants from Singapore (2.6%, a difference of 0.31%), Immigrants from Israel (2.6%, a difference of 0.38%), and Jamaican (2.7%, a difference of 0.42%).
| Demographics | Rating | Rank | Hearing Disability |
| Senegalese | 99.4 /100 | #43 | Exceptional 2.6% |
| Nigerians | 99.4 /100 | #44 | Exceptional 2.6% |
| Venezuelans | 99.4 /100 | #45 | Exceptional 2.6% |
| Immigrants | Dominica | 99.3 /100 | #46 | Exceptional 2.6% |
| Immigrants | Israel | 99.3 /100 | #47 | Exceptional 2.6% |
| Immigrants | Singapore | 99.3 /100 | #48 | Exceptional 2.6% |
| Immigrants | South America | 99.2 /100 | #49 | Exceptional 2.7% |
| Paraguayans | 99.2 /100 | #50 | Exceptional 2.7% |
| Immigrants | Hong Kong | 99.2 /100 | #51 | Exceptional 2.7% |
| Jamaicans | 99.0 /100 | #52 | Exceptional 2.7% |
| Immigrants | Eastern Asia | 99.0 /100 | #53 | Exceptional 2.7% |
| Ethiopians | 99.0 /100 | #54 | Exceptional 2.7% |
| Immigrants | Ethiopia | 99.0 /100 | #55 | Exceptional 2.7% |
| Immigrants | Nicaragua | 99.0 /100 | #56 | Exceptional 2.7% |
| South Americans | 99.0 /100 | #57 | Exceptional 2.7% |
Demographics Similar to Carpatho Rusyns by Hearing Disability
In terms of hearing disability, the demographic groups most similar to Carpatho Rusyns are Slavic (3.4%, a difference of 0.42%), Croatian (3.4%, a difference of 0.45%), Polish (3.4%, a difference of 0.65%), Hungarian (3.4%, a difference of 0.66%), and Hmong (3.4%, a difference of 0.70%).
| Demographics | Rating | Rank | Hearing Disability |
| Immigrants | England | 0.7 /100 | #246 | Tragic 3.3% |
| Lithuanians | 0.6 /100 | #247 | Tragic 3.4% |
| Austrians | 0.6 /100 | #248 | Tragic 3.4% |
| Italians | 0.4 /100 | #249 | Tragic 3.4% |
| Yuman | 0.4 /100 | #250 | Tragic 3.4% |
| Hungarians | 0.4 /100 | #251 | Tragic 3.4% |
| Croatians | 0.4 /100 | #252 | Tragic 3.4% |
| Carpatho Rusyns | 0.3 /100 | #253 | Tragic 3.4% |
| Slavs | 0.2 /100 | #254 | Tragic 3.4% |
| Poles | 0.2 /100 | #255 | Tragic 3.4% |
| Hmong | 0.2 /100 | #256 | Tragic 3.4% |
| Yaqui | 0.2 /100 | #257 | Tragic 3.4% |
| Northern Europeans | 0.2 /100 | #258 | Tragic 3.4% |
| Slovenes | 0.1 /100 | #259 | Tragic 3.5% |
| Portuguese | 0.1 /100 | #260 | Tragic 3.5% |