Palestinian vs Native Hawaiian Disability Age Over 75

COMPARE

Palestinian
Race
Ancestry
AfghanAfricanAlaska NativeAlaskan AthabascanAlbanianAleutAlsatianAmericanApacheArabArapahoArgentineanArmenianAssyrian/Chaldean/SyriacAustralianAustrianBahamianBangladeshiBarbadianBasqueBelgianBelizeanBermudanBhutaneseBlackfeetBolivianBrazilianBritishBritish West IndianBulgarianBurmeseCajunCambodianCanadianCape VerdeanCarpatho RusynCelticCentral AmericanCentral American IndianCherokeeCheyenneChickasawChileanChineseChippewaChoctawColombianColvilleComancheCosta RicanCreeCreekCroatianCrowCubanCypriotCzechCzechoslovakianDanishDelawareDominicanDutchDutch West IndianEastern EuropeanEcuadorianEgyptianEnglishEstonianEthiopianEuropeanFijianFilipinoFinnishFrenchFrench American IndianFrench CanadianGermanGerman RussianGhanaianGreekGuamanian/ChamorroGuatemalanGuyaneseHaitianHmongHonduranHopiHoumaHungarianIcelanderIndian (Asian)IndonesianInupiatIranianIraqiIrishIroquoisIsraeliItalianJamaicanJapaneseJordanianKenyanKiowaKoreanLaotianLatvianLebaneseLiberianLithuanianLumbeeLuxembourgerMacedonianMalaysianMalteseMarshalleseMenomineeMexicanMexican American IndianMongolianMoroccanNavajoNepaleseNew ZealanderNicaraguanNigerianNorthern EuropeanNorwegianOkinawanOsageOttawaPaiutePakistaniPalestinianPanamanianParaguayanPennsylvania GermanPeruvianPimaPolishPortuguesePotawatomiPuebloPuerto RicanPuget Sound SalishRomanianRussianSalvadoranSamoanScandinavianScotch-IrishScottishSeminoleSenegaleseSerbianShoshoneSierra LeoneanSiouxSlavicSlovakSloveneSomaliSouth AfricanSouth AmericanSouth American IndianSoviet UnionSpaniardSpanishSpanish AmericanSpanish American IndianSri LankanSubsaharan AfricanSudaneseSwedishSwissSyrianTaiwaneseThaiTlingit-HaidaTohono O'OdhamTonganTrinidadian and TobagonianTsimshianTurkishU.S. Virgin IslanderUgandanUkrainianUruguayanUteVenezuelanVietnameseWelshWest IndianYakamaYaquiYugoslavianYumanYup'ikZimbabwean
Immigration
NonimmigrantsImmigrantsAfghanistanAfricaAlbaniaArgentinaArmeniaAsiaAustraliaAustriaBahamasBangladeshBarbadosBelarusBelgiumBelizeBoliviaBosnia and HerzegovinaBrazilBulgariaBurma/MyanmarCabo VerdeCambodiaCameroonCanadaCaribbeanCentral AmericaChileChinaColombiaCongoCosta RicaCroatiaCubaCzechoslovakiaDenmarkDominicaDominican RepublicEastern AfricaEastern AsiaEastern EuropeEcuadorEgyptEl SalvadorEnglandEritreaEthiopiaEuropeFijiFranceGermanyGhanaGreeceGrenadaGuatemalaGuyanaHaitiHondurasHong KongHungaryIndiaIndonesiaIranIraqIrelandIsraelItalyJamaicaJapanJordanKazakhstanKenyaKoreaKuwaitLaosLatin AmericaLatviaLebanonLiberiaLithuaniaMalaysiaMexicoMicronesiaMiddle AfricaMoldovaMoroccoNepalNetherlandsNicaraguaNigeriaNorth AmericaNorth MacedoniaNorthern AfricaNorthern EuropeNorwayOceaniaPakistanPanamaPeruPhilippinesPolandPortugalRomaniaRussiaSaudi ArabiaScotlandSenegalSerbiaSierra LeoneSingaporeSomaliaSouth AfricaSouth AmericaSouth Central AsiaSouth Eastern AsiaSouthern EuropeSpainSri LankaSt. Vincent and the GrenadinesSudanSwedenSwitzerlandSyriaTaiwanThailandTrinidad and TobagoTurkeyUgandaUkraineUruguayUzbekistanVenezuelaVietnamWest IndiesWestern AfricaWestern AsiaWestern EuropeYemenZaireZimbabweAzores
Native Hawaiian
Race
Ancestry
AfghanAfricanAlaska NativeAlaskan AthabascanAlbanianAleutAlsatianAmericanApacheArabArapahoArgentineanArmenianAssyrian/Chaldean/SyriacAustralianAustrianBahamianBangladeshiBarbadianBasqueBelgianBelizeanBermudanBhutaneseBlackfeetBolivianBrazilianBritishBritish West IndianBulgarianBurmeseCajunCambodianCanadianCape VerdeanCarpatho RusynCelticCentral AmericanCentral American IndianCherokeeCheyenneChickasawChileanChineseChippewaChoctawColombianColvilleComancheCosta RicanCreeCreekCroatianCrowCubanCypriotCzechCzechoslovakianDanishDelawareDominicanDutchDutch West IndianEastern EuropeanEcuadorianEgyptianEnglishEstonianEthiopianEuropeanFijianFilipinoFinnishFrenchFrench American IndianFrench CanadianGermanGerman RussianGhanaianGreekGuamanian/ChamorroGuatemalanGuyaneseHaitianHmongHonduranHopiHoumaHungarianIcelanderIndian (Asian)IndonesianInupiatIranianIraqiIrishIroquoisIsraeliItalianJamaicanJapaneseJordanianKenyanKiowaKoreanLaotianLatvianLebaneseLiberianLithuanianLumbeeLuxembourgerMacedonianMalaysianMalteseMarshalleseMenomineeMexicanMexican American IndianMongolianMoroccanNative HawaiianNavajoNepaleseNew ZealanderNicaraguanNigerianNorthern EuropeanNorwegianOkinawanOsageOttawaPaiutePakistaniPanamanianParaguayanPennsylvania GermanPeruvianPimaPolishPortuguesePotawatomiPuebloPuerto RicanPuget Sound SalishRomanianRussianSalvadoranSamoanScandinavianScotch-IrishScottishSeminoleSenegaleseSerbianShoshoneSierra LeoneanSiouxSlavicSlovakSloveneSomaliSouth AfricanSouth AmericanSouth American IndianSoviet UnionSpaniardSpanishSpanish AmericanSpanish American IndianSri LankanSubsaharan AfricanSudaneseSwedishSwissSyrianTaiwaneseThaiTlingit-HaidaTohono O'OdhamTonganTrinidadian and TobagonianTsimshianTurkishU.S. Virgin IslanderUgandanUkrainianUruguayanUteVenezuelanVietnameseWelshWest IndianYakamaYaquiYugoslavianYumanYup'ikZimbabwean
Immigration
NonimmigrantsImmigrantsAfghanistanAfricaAlbaniaArgentinaArmeniaAsiaAustraliaAustriaBahamasBangladeshBarbadosBelarusBelgiumBelizeBoliviaBosnia and HerzegovinaBrazilBulgariaBurma/MyanmarCabo VerdeCambodiaCameroonCanadaCaribbeanCentral AmericaChileChinaColombiaCongoCosta RicaCroatiaCubaCzechoslovakiaDenmarkDominicaDominican RepublicEastern AfricaEastern AsiaEastern EuropeEcuadorEgyptEl SalvadorEnglandEritreaEthiopiaEuropeFijiFranceGermanyGhanaGreeceGrenadaGuatemalaGuyanaHaitiHondurasHong KongHungaryIndiaIndonesiaIranIraqIrelandIsraelItalyJamaicaJapanJordanKazakhstanKenyaKoreaKuwaitLaosLatin AmericaLatviaLebanonLiberiaLithuaniaMalaysiaMexicoMicronesiaMiddle AfricaMoldovaMoroccoNepalNetherlandsNicaraguaNigeriaNorth AmericaNorth MacedoniaNorthern AfricaNorthern EuropeNorwayOceaniaPakistanPanamaPeruPhilippinesPolandPortugalRomaniaRussiaSaudi ArabiaScotlandSenegalSerbiaSierra LeoneSingaporeSomaliaSouth AfricaSouth AmericaSouth Central AsiaSouth Eastern AsiaSouthern EuropeSpainSri LankaSt. Vincent and the GrenadinesSudanSwedenSwitzerlandSyriaTaiwanThailandTrinidad and TobagoTurkeyUgandaUkraineUruguayUzbekistanVenezuelaVietnamWest IndiesWestern AfricaWestern AsiaWestern EuropeYemenZaireZimbabweAzores
Disability Age Over 75
Income
Poverty
Unemployment
Labor Participation
Family Structure
Vehicle Availability
Education Level
Disability

Disability Age Over 75 Comparison

Palestinians

Native Hawaiians

Exceptional
Tragic
46.3%
DISABILITY AGE OVER 75
97.7/ 100
METRIC RATING
99th/ 347
METRIC RANK
48.3%
DISABILITY AGE OVER 75
2.2/ 100
METRIC RATING
241st/ 347
METRIC RANK

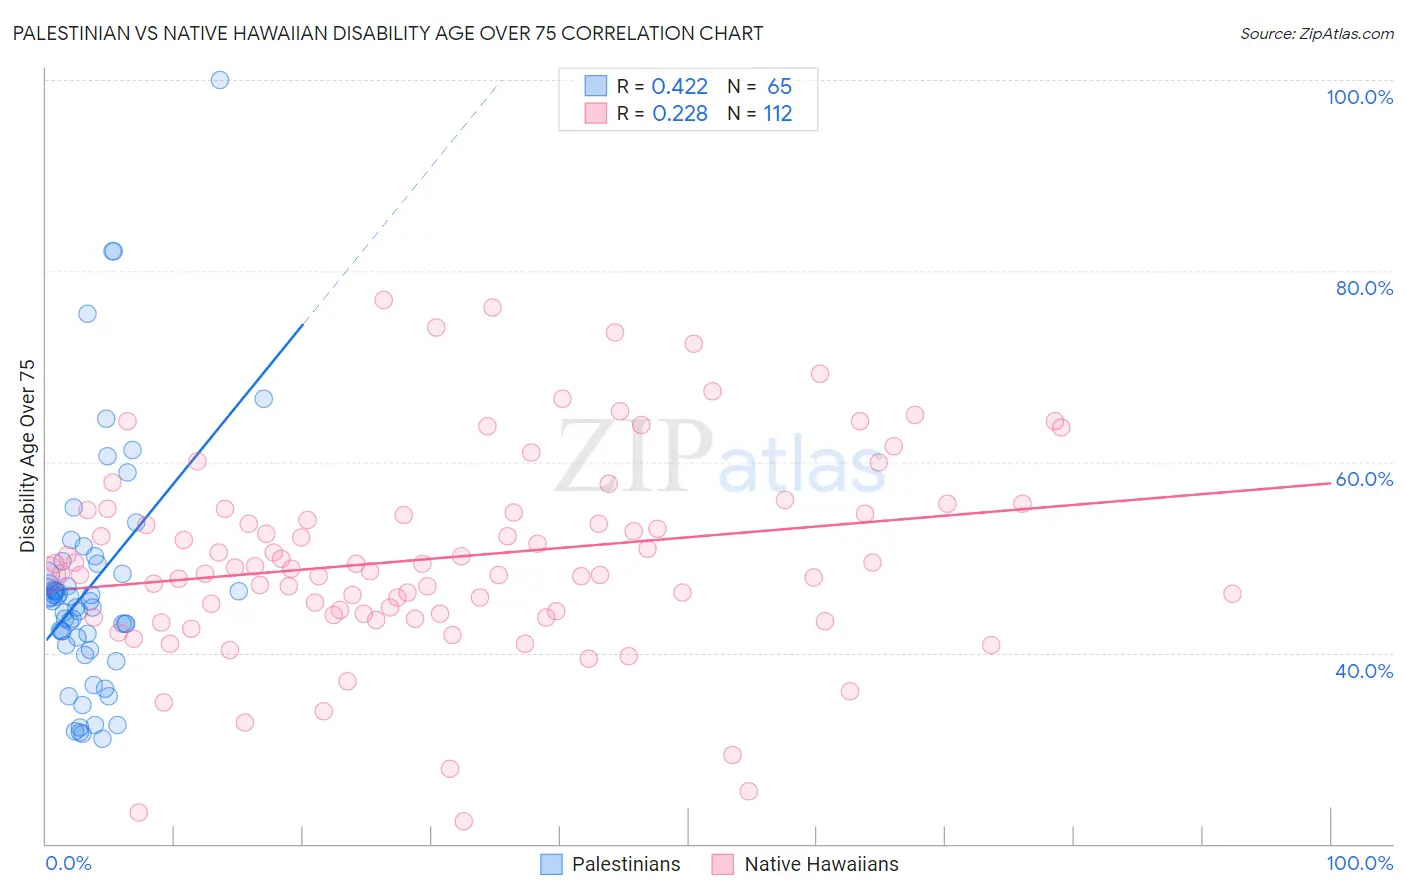
Palestinian vs Native Hawaiian Disability Age Over 75 Correlation Chart

The statistical analysis conducted on geographies consisting of 216,314,084 people shows a moderate positive correlation between the proportion of Palestinians and percentage of population with a disability over the age of 75 in the United States with a correlation coefficient (R) of 0.422 and weighted average of 46.3%. Similarly, the statistical analysis conducted on geographies consisting of 331,313,061 people shows a weak positive correlation between the proportion of Native Hawaiians and percentage of population with a disability over the age of 75 in the United States with a correlation coefficient (R) of 0.228 and weighted average of 48.3%, a difference of 4.3%.
Palestinian vs Native Hawaiian Disability Age Over 75

Disability Age Over 75 Correlation Summary

MeasurementPalestinianNative Hawaiian
Minimum31.0%22.3%
Maximum100.0%76.9%
Range69.0%54.6%
Mean47.0%50.0%
Median45.4%48.9%
Interquartile 25% (IQ1)41.2%44.1%
Interquartile 75% (IQ3)48.8%54.8%
Interquartile Range (IQR)7.5%10.7%
Standard Deviation (Sample)12.6%10.5%
Standard Deviation (Population)12.5%10.4%

Similar Demographics by Disability Age Over 75

Demographics Similar to Palestinians by Disability Age Over 75

In terms of disability age over 75, the demographic groups most similar to Palestinians are Immigrants from Eastern Europe (46.3%, a difference of 0.0%), Mongolian (46.3%, a difference of 0.0%), Immigrants from Japan (46.3%, a difference of 0.040%), Finnish (46.3%, a difference of 0.050%), and Immigrants from China (46.3%, a difference of 0.070%).
DemographicsRating | RankDisability Age Over 75
Germans
98.2
/100
|
#92
Exceptional
46.3%
Ugandans
98.2
/100
|
#93
Exceptional
46.3%
Albanians
98.1
/100
|
#94
Exceptional
46.3%
Immigrants | Brazil
98.0
/100
|
#95
Exceptional
46.3%
Immigrants | China
98.0
/100
|
#96
Exceptional
46.3%
Finns
97.9
/100
|
#97
Exceptional
46.3%
Immigrants | Japan
97.8
/100
|
#98
Exceptional
46.3%
Palestinians
97.7
/100
|
#99
Exceptional
46.3%
Immigrants | Eastern Europe
97.7
/100
|
#100
Exceptional
46.3%
Mongolians
97.7
/100
|
#101
Exceptional
46.3%
Immigrants | Malaysia
97.1
/100
|
#102
Exceptional
46.4%
Ukrainians
97.1
/100
|
#103
Exceptional
46.4%
Israelis
97.0
/100
|
#104
Exceptional
46.4%
Immigrants | Cameroon
96.9
/100
|
#105
Exceptional
46.4%
Immigrants | Kuwait
96.8
/100
|
#106
Exceptional
46.4%

Demographics Similar to Native Hawaiians by Disability Age Over 75

In terms of disability age over 75, the demographic groups most similar to Native Hawaiians are French American Indian (48.3%, a difference of 0.0%), Tongan (48.3%, a difference of 0.010%), Immigrants from Caribbean (48.4%, a difference of 0.040%), Immigrants from Thailand (48.3%, a difference of 0.12%), and Afghan (48.4%, a difference of 0.13%).
DemographicsRating | RankDisability Age Over 75
Sub-Saharan Africans
3.8
/100
|
#234
Tragic
48.2%
Hmong
3.8
/100
|
#235
Tragic
48.2%
Immigrants | Nicaragua
3.2
/100
|
#236
Tragic
48.2%
Immigrants | St. Vincent and the Grenadines
3.2
/100
|
#237
Tragic
48.2%
Nicaraguans
3.0
/100
|
#238
Tragic
48.3%
Immigrants | Thailand
2.8
/100
|
#239
Tragic
48.3%
Tongans
2.3
/100
|
#240
Tragic
48.3%
Native Hawaiians
2.2
/100
|
#241
Tragic
48.3%
French American Indians
2.2
/100
|
#242
Tragic
48.3%
Immigrants | Caribbean
2.1
/100
|
#243
Tragic
48.4%
Afghans
1.8
/100
|
#244
Tragic
48.4%
Americans
1.7
/100
|
#245
Tragic
48.4%
Chippewa
1.6
/100
|
#246
Tragic
48.4%
Iroquois
1.6
/100
|
#247
Tragic
48.4%
Sri Lankans
1.4
/100
|
#248
Tragic
48.5%