Pakistani vs Swedish Ambulatory Disability
COMPARE
Pakistani
Swedish
Ambulatory Disability
Ambulatory Disability Comparison
Pakistanis
Swedes
6.0%
AMBULATORY DISABILITY
82.5/ 100
METRIC RATING
145th/ 347
METRIC RANK
6.0%
AMBULATORY DISABILITY
83.1/ 100
METRIC RATING
141st/ 347
METRIC RANK
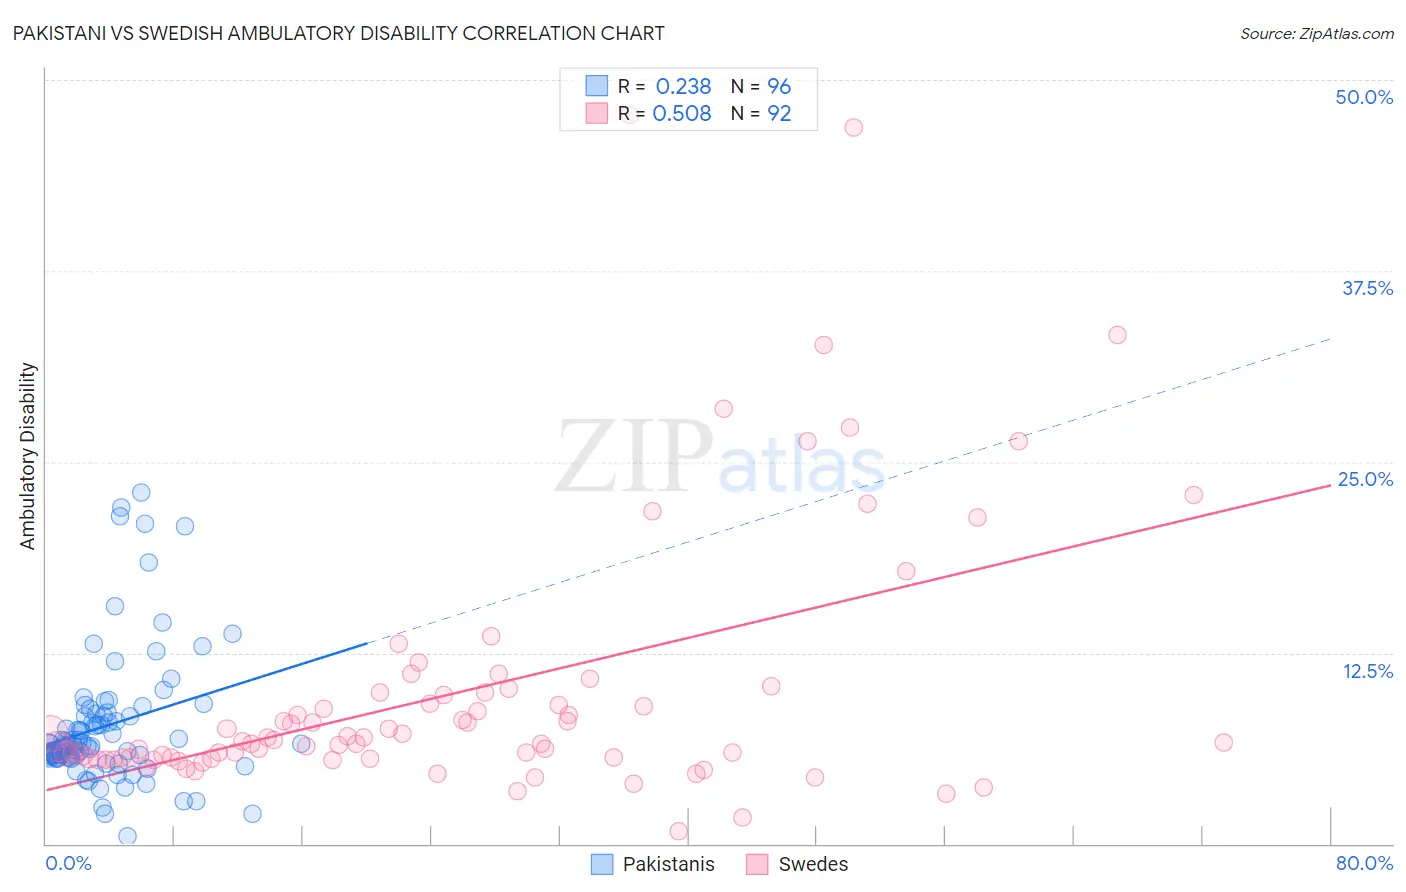
Pakistani vs Swedish Ambulatory Disability Correlation Chart
The statistical analysis conducted on geographies consisting of 335,239,652 people shows a weak positive correlation between the proportion of Pakistanis and percentage of population with ambulatory disability in the United States with a correlation coefficient (R) of 0.238 and weighted average of 6.0%. Similarly, the statistical analysis conducted on geographies consisting of 538,852,545 people shows a substantial positive correlation between the proportion of Swedes and percentage of population with ambulatory disability in the United States with a correlation coefficient (R) of 0.508 and weighted average of 6.0%, a difference of 0.060%.
Ambulatory Disability Correlation Summary
| Measurement | Pakistani | Swedish |
| Minimum | 0.47% | 0.84% |
| Maximum | 23.0% | 47.7% |
| Range | 22.6% | 46.9% |
| Mean | 7.7% | 9.9% |
| Median | 6.4% | 6.7% |
| Interquartile 25% (IQ1) | 5.6% | 5.6% |
| Interquartile 75% (IQ3) | 8.5% | 9.8% |
| Interquartile Range (IQR) | 2.8% | 4.3% |
| Standard Deviation (Sample) | 4.4% | 8.7% |
| Standard Deviation (Population) | 4.3% | 8.6% |
Demographics Similar to Pakistanis and Swedes by Ambulatory Disability
In terms of ambulatory disability, the demographic groups most similar to Pakistanis are Immigrants from Greece (6.0%, a difference of 0.0%), Immigrants from Moldova (6.0%, a difference of 0.010%), Macedonian (6.0%, a difference of 0.030%), Romanian (6.0%, a difference of 0.040%), and Immigrants from Philippines (6.0%, a difference of 0.050%). Similarly, the demographic groups most similar to Swedes are Immigrants from Philippines (6.0%, a difference of 0.010%), Czech (6.0%, a difference of 0.020%), Romanian (6.0%, a difference of 0.020%), Macedonian (6.0%, a difference of 0.030%), and Immigrants from Zaire (6.0%, a difference of 0.050%).
| Demographics | Rating | Rank | Ambulatory Disability |
| Immigrants | Immigrants | 86.9 /100 | #133 | Excellent 6.0% |
| Ute | 86.6 /100 | #134 | Excellent 6.0% |
| Immigrants | Italy | 85.0 /100 | #135 | Excellent 6.0% |
| Immigrants | North Macedonia | 84.1 /100 | #136 | Excellent 6.0% |
| Immigrants | Syria | 84.1 /100 | #137 | Excellent 6.0% |
| Immigrants | Hungary | 83.9 /100 | #138 | Excellent 6.0% |
| Immigrants | Zaire | 83.6 /100 | #139 | Excellent 6.0% |
| Czechs | 83.3 /100 | #140 | Excellent 6.0% |
| Swedes | 83.1 /100 | #141 | Excellent 6.0% |
| Immigrants | Philippines | 83.0 /100 | #142 | Excellent 6.0% |
| Romanians | 82.9 /100 | #143 | Excellent 6.0% |
| Macedonians | 82.8 /100 | #144 | Excellent 6.0% |
| Pakistanis | 82.5 /100 | #145 | Excellent 6.0% |
| Immigrants | Greece | 82.5 /100 | #146 | Excellent 6.0% |
| Immigrants | Moldova | 82.4 /100 | #147 | Excellent 6.0% |
| Immigrants | Eastern Europe | 82.0 /100 | #148 | Excellent 6.0% |
| Lithuanians | 81.9 /100 | #149 | Excellent 6.0% |
| Maltese | 81.6 /100 | #150 | Excellent 6.0% |
| Greeks | 79.6 /100 | #151 | Good 6.0% |
| Immigrants | Austria | 78.8 /100 | #152 | Good 6.0% |
| Syrians | 75.5 /100 | #153 | Good 6.0% |