Pakistani vs Native/Alaskan Disability Age 35 to 64
COMPARE
Pakistani
Native/Alaskan
Disability Age 35 to 64
Disability Age 35 to 64 Comparison
Pakistanis
Natives/Alaskans
11.1%
DISABILITY AGE 35 TO 64
65.8/ 100
METRIC RATING
164th/ 347
METRIC RANK
15.3%
DISABILITY AGE 35 TO 64
0.0/ 100
METRIC RATING
326th/ 347
METRIC RANK
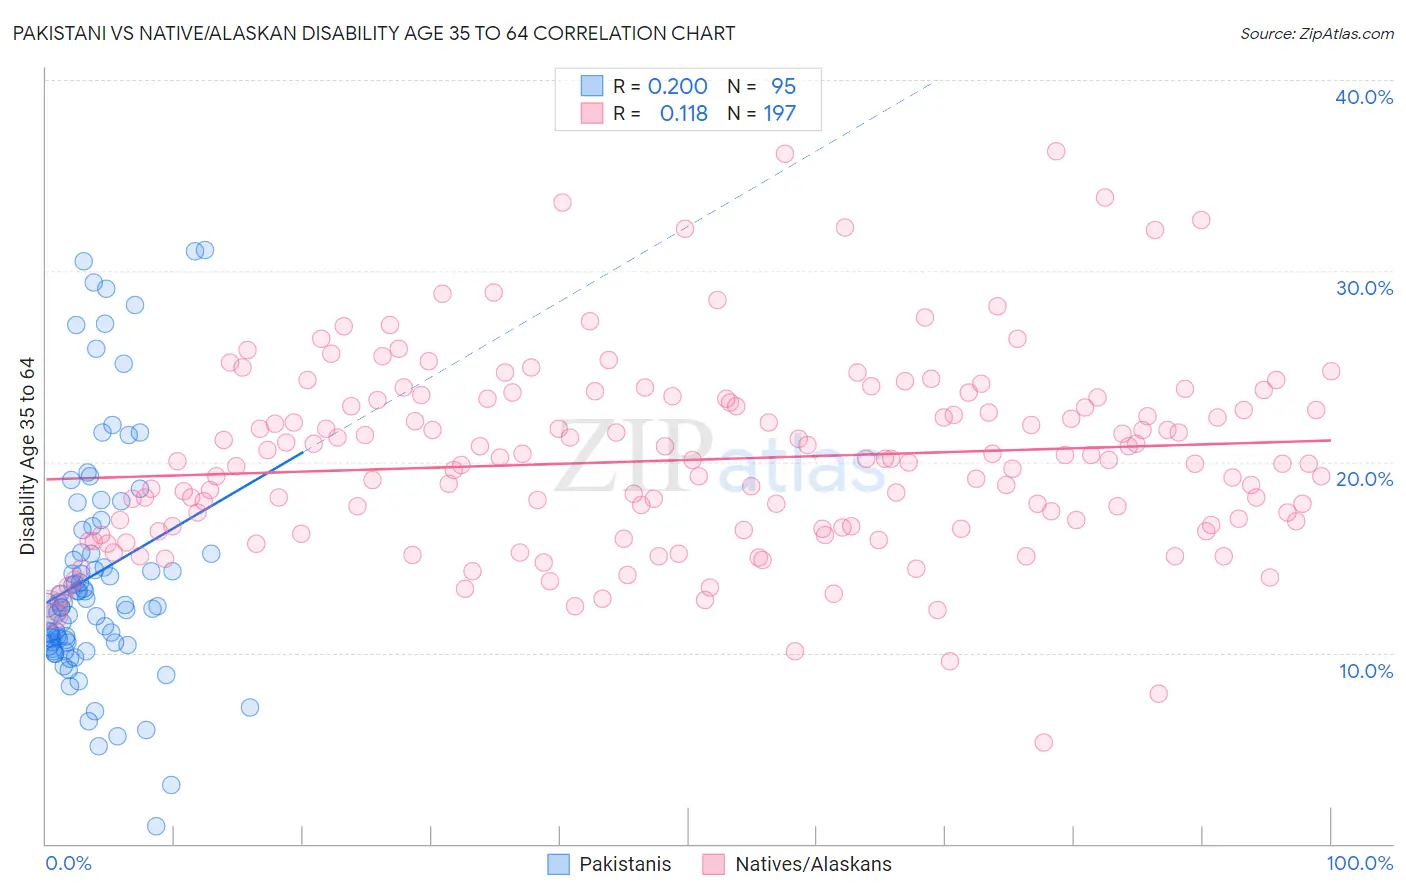
Pakistani vs Native/Alaskan Disability Age 35 to 64 Correlation Chart
The statistical analysis conducted on geographies consisting of 335,157,487 people shows a poor positive correlation between the proportion of Pakistanis and percentage of population with a disability between the ages 34 and 64 in the United States with a correlation coefficient (R) of 0.200 and weighted average of 11.1%. Similarly, the statistical analysis conducted on geographies consisting of 512,516,181 people shows a poor positive correlation between the proportion of Natives/Alaskans and percentage of population with a disability between the ages 34 and 64 in the United States with a correlation coefficient (R) of 0.118 and weighted average of 15.3%, a difference of 37.6%.
Disability Age 35 to 64 Correlation Summary
| Measurement | Pakistani | Native/Alaskan |
| Minimum | 0.93% | 5.3% |
| Maximum | 31.1% | 36.2% |
| Range | 30.1% | 31.0% |
| Mean | 14.1% | 20.1% |
| Median | 12.5% | 20.0% |
| Interquartile 25% (IQ1) | 10.5% | 16.5% |
| Interquartile 75% (IQ3) | 16.5% | 23.2% |
| Interquartile Range (IQR) | 5.9% | 6.7% |
| Standard Deviation (Sample) | 6.3% | 5.0% |
| Standard Deviation (Population) | 6.2% | 5.0% |
Similar Demographics by Disability Age 35 to 64
Demographics Similar to Pakistanis by Disability Age 35 to 64
In terms of disability age 35 to 64, the demographic groups most similar to Pakistanis are Immigrants from Western Europe (11.1%, a difference of 0.050%), Immigrants from St. Vincent and the Grenadines (11.1%, a difference of 0.080%), Immigrants from Haiti (11.1%, a difference of 0.17%), Austrian (11.1%, a difference of 0.23%), and Immigrants from Grenada (11.1%, a difference of 0.24%).
| Demographics | Rating | Rank | Disability Age 35 to 64 |
| Guyanese | 75.1 /100 | #157 | Good 11.0% |
| Immigrants | North America | 74.9 /100 | #158 | Good 11.0% |
| Serbians | 73.6 /100 | #159 | Good 11.0% |
| Croatians | 73.1 /100 | #160 | Good 11.0% |
| Immigrants | Guyana | 70.1 /100 | #161 | Good 11.1% |
| Immigrants | Grenada | 68.4 /100 | #162 | Good 11.1% |
| Immigrants | St. Vincent and the Grenadines | 66.6 /100 | #163 | Good 11.1% |
| Pakistanis | 65.8 /100 | #164 | Good 11.1% |
| Immigrants | Western Europe | 65.2 /100 | #165 | Good 11.1% |
| Immigrants | Haiti | 63.8 /100 | #166 | Good 11.1% |
| Austrians | 63.2 /100 | #167 | Good 11.1% |
| Central Americans | 59.1 /100 | #168 | Average 11.2% |
| Haitians | 59.0 /100 | #169 | Average 11.2% |
| Immigrants | Uganda | 58.0 /100 | #170 | Average 11.2% |
| Immigrants | Trinidad and Tobago | 55.9 /100 | #171 | Average 11.2% |
Demographics Similar to Natives/Alaskans by Disability Age 35 to 64
In terms of disability age 35 to 64, the demographic groups most similar to Natives/Alaskans are Pueblo (15.3%, a difference of 0.020%), Cajun (15.3%, a difference of 0.20%), Cherokee (15.5%, a difference of 0.95%), Navajo (15.5%, a difference of 1.2%), and Arapaho (15.1%, a difference of 1.6%).
| Demographics | Rating | Rank | Disability Age 35 to 64 |
| Immigrants | Cabo Verde | 0.0 /100 | #319 | Tragic 14.7% |
| Blacks/African Americans | 0.0 /100 | #320 | Tragic 14.7% |
| Comanche | 0.0 /100 | #321 | Tragic 14.7% |
| Potawatomi | 0.0 /100 | #322 | Tragic 14.8% |
| Apache | 0.0 /100 | #323 | Tragic 14.9% |
| Chippewa | 0.0 /100 | #324 | Tragic 15.0% |
| Arapaho | 0.0 /100 | #325 | Tragic 15.1% |
| Natives/Alaskans | 0.0 /100 | #326 | Tragic 15.3% |
| Pueblo | 0.0 /100 | #327 | Tragic 15.3% |
| Cajuns | 0.0 /100 | #328 | Tragic 15.3% |
| Cherokee | 0.0 /100 | #329 | Tragic 15.5% |
| Navajo | 0.0 /100 | #330 | Tragic 15.5% |
| Dutch West Indians | 0.0 /100 | #331 | Tragic 15.6% |
| Alaskan Athabascans | 0.0 /100 | #332 | Tragic 15.7% |
| Yuman | 0.0 /100 | #333 | Tragic 15.8% |