Pakistani vs Immigrants from Australia Cognitive Disability
COMPARE
Pakistani
Immigrants from Australia
Cognitive Disability
Cognitive Disability Comparison
Pakistanis
Immigrants from Australia
17.3%
COGNITIVE DISABILITY
43.9/ 100
METRIC RATING
180th/ 347
METRIC RANK
17.1%
COGNITIVE DISABILITY
76.0/ 100
METRIC RATING
157th/ 347
METRIC RANK
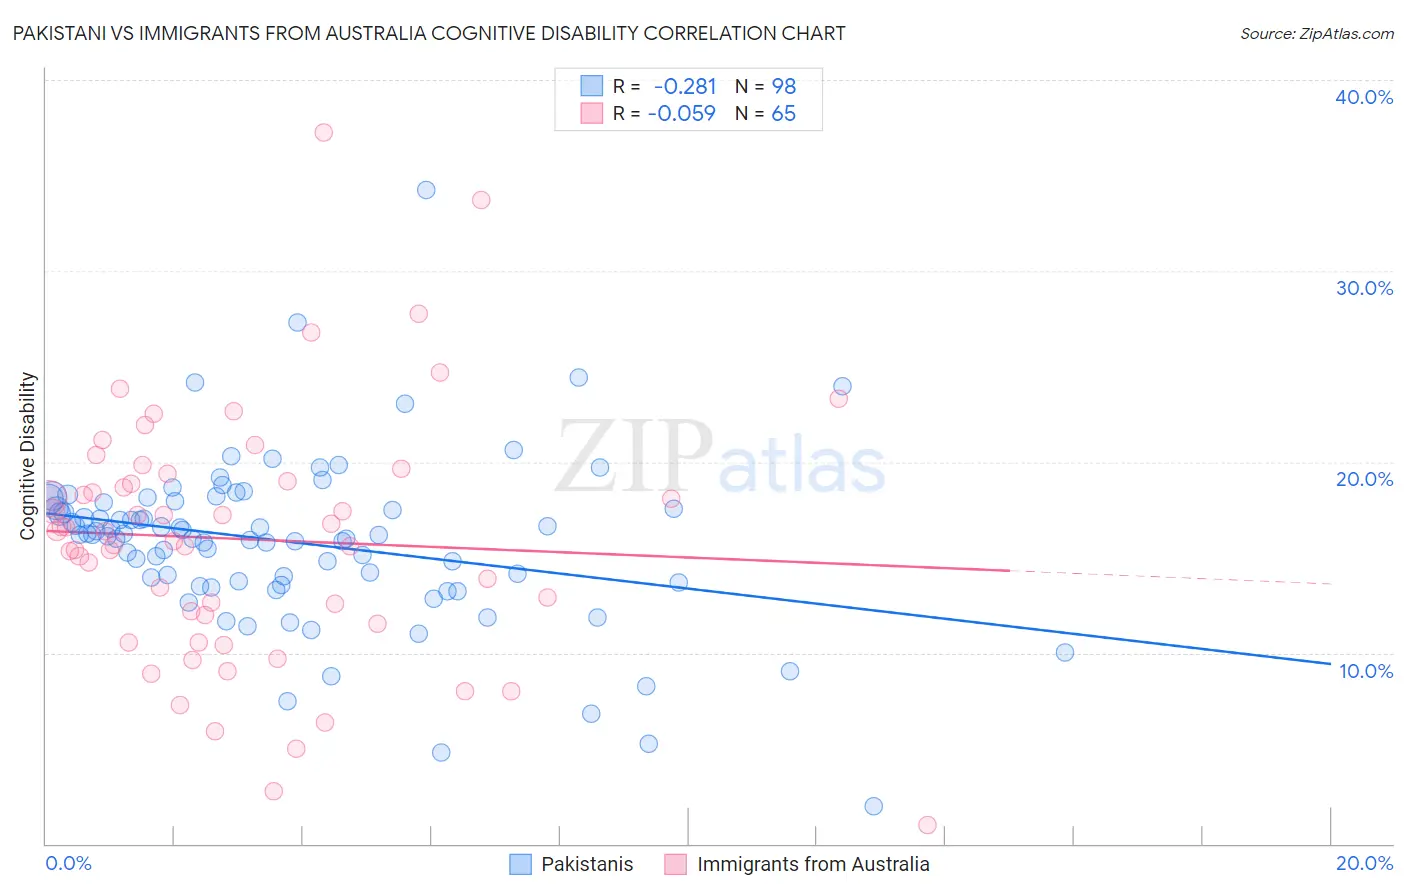
Pakistani vs Immigrants from Australia Cognitive Disability Correlation Chart
The statistical analysis conducted on geographies consisting of 335,302,267 people shows a weak negative correlation between the proportion of Pakistanis and percentage of population with cognitive disability in the United States with a correlation coefficient (R) of -0.281 and weighted average of 17.3%. Similarly, the statistical analysis conducted on geographies consisting of 227,201,073 people shows a slight negative correlation between the proportion of Immigrants from Australia and percentage of population with cognitive disability in the United States with a correlation coefficient (R) of -0.059 and weighted average of 17.1%, a difference of 1.0%.
Cognitive Disability Correlation Summary
| Measurement | Pakistani | Immigrants from Australia |
| Minimum | 2.0% | 0.98% |
| Maximum | 34.2% | 37.3% |
| Range | 32.2% | 36.3% |
| Mean | 15.8% | 15.9% |
| Median | 16.2% | 16.4% |
| Interquartile 25% (IQ1) | 13.7% | 11.8% |
| Interquartile 75% (IQ3) | 17.9% | 19.2% |
| Interquartile Range (IQR) | 4.2% | 7.4% |
| Standard Deviation (Sample) | 4.5% | 6.6% |
| Standard Deviation (Population) | 4.4% | 6.5% |
Similar Demographics by Cognitive Disability
Demographics Similar to Pakistanis by Cognitive Disability
In terms of cognitive disability, the demographic groups most similar to Pakistanis are Immigrants from Guyana (17.3%, a difference of 0.030%), Arab (17.3%, a difference of 0.030%), Spaniard (17.3%, a difference of 0.10%), Sioux (17.3%, a difference of 0.13%), and Spanish (17.3%, a difference of 0.14%).
| Demographics | Rating | Rank | Cognitive Disability |
| Immigrants | Northern Africa | 50.2 /100 | #173 | Average 17.3% |
| Laotians | 50.0 /100 | #174 | Average 17.3% |
| Tsimshian | 49.8 /100 | #175 | Average 17.3% |
| Shoshone | 49.2 /100 | #176 | Average 17.3% |
| Ute | 49.1 /100 | #177 | Average 17.3% |
| Spanish | 48.9 /100 | #178 | Average 17.3% |
| Sioux | 48.6 /100 | #179 | Average 17.3% |
| Pakistanis | 43.9 /100 | #180 | Average 17.3% |
| Immigrants | Guyana | 42.9 /100 | #181 | Average 17.3% |
| Arabs | 42.8 /100 | #182 | Average 17.3% |
| Spaniards | 40.3 /100 | #183 | Average 17.3% |
| Crow | 39.1 /100 | #184 | Fair 17.3% |
| Afghans | 38.2 /100 | #185 | Fair 17.3% |
| Cambodians | 35.9 /100 | #186 | Fair 17.3% |
| Immigrants | Fiji | 33.7 /100 | #187 | Fair 17.4% |
Demographics Similar to Immigrants from Australia by Cognitive Disability
In terms of cognitive disability, the demographic groups most similar to Immigrants from Australia are Celtic (17.1%, a difference of 0.070%), Immigrants from Latvia (17.2%, a difference of 0.11%), Brazilian (17.1%, a difference of 0.12%), Sri Lankan (17.1%, a difference of 0.12%), and Immigrants from Malaysia (17.1%, a difference of 0.14%).
| Demographics | Rating | Rank | Cognitive Disability |
| Basques | 85.5 /100 | #150 | Excellent 17.1% |
| Syrians | 83.0 /100 | #151 | Excellent 17.1% |
| Immigrants | Indonesia | 82.7 /100 | #152 | Excellent 17.1% |
| Immigrants | Kazakhstan | 80.5 /100 | #153 | Excellent 17.1% |
| Immigrants | Malaysia | 79.3 /100 | #154 | Good 17.1% |
| Brazilians | 78.9 /100 | #155 | Good 17.1% |
| Sri Lankans | 78.9 /100 | #156 | Good 17.1% |
| Immigrants | Australia | 76.0 /100 | #157 | Good 17.1% |
| Celtics | 74.1 /100 | #158 | Good 17.1% |
| Immigrants | Latvia | 73.2 /100 | #159 | Good 17.2% |
| Australians | 72.4 /100 | #160 | Good 17.2% |
| Americans | 72.2 /100 | #161 | Good 17.2% |
| Yugoslavians | 71.6 /100 | #162 | Good 17.2% |
| Immigrants | Switzerland | 71.5 /100 | #163 | Good 17.2% |
| Armenians | 70.1 /100 | #164 | Good 17.2% |