Osage vs Bangladeshi Disability Age 65 to 74
COMPARE
Osage
Bangladeshi
Disability Age 65 to 74
Disability Age 65 to 74 Comparison
Osage
Bangladeshis
27.5%
DISABILITY AGE 65 TO 74
0.0/ 100
METRIC RATING
312th/ 347
METRIC RANK
26.8%
DISABILITY AGE 65 TO 74
0.0/ 100
METRIC RATING
296th/ 347
METRIC RANK
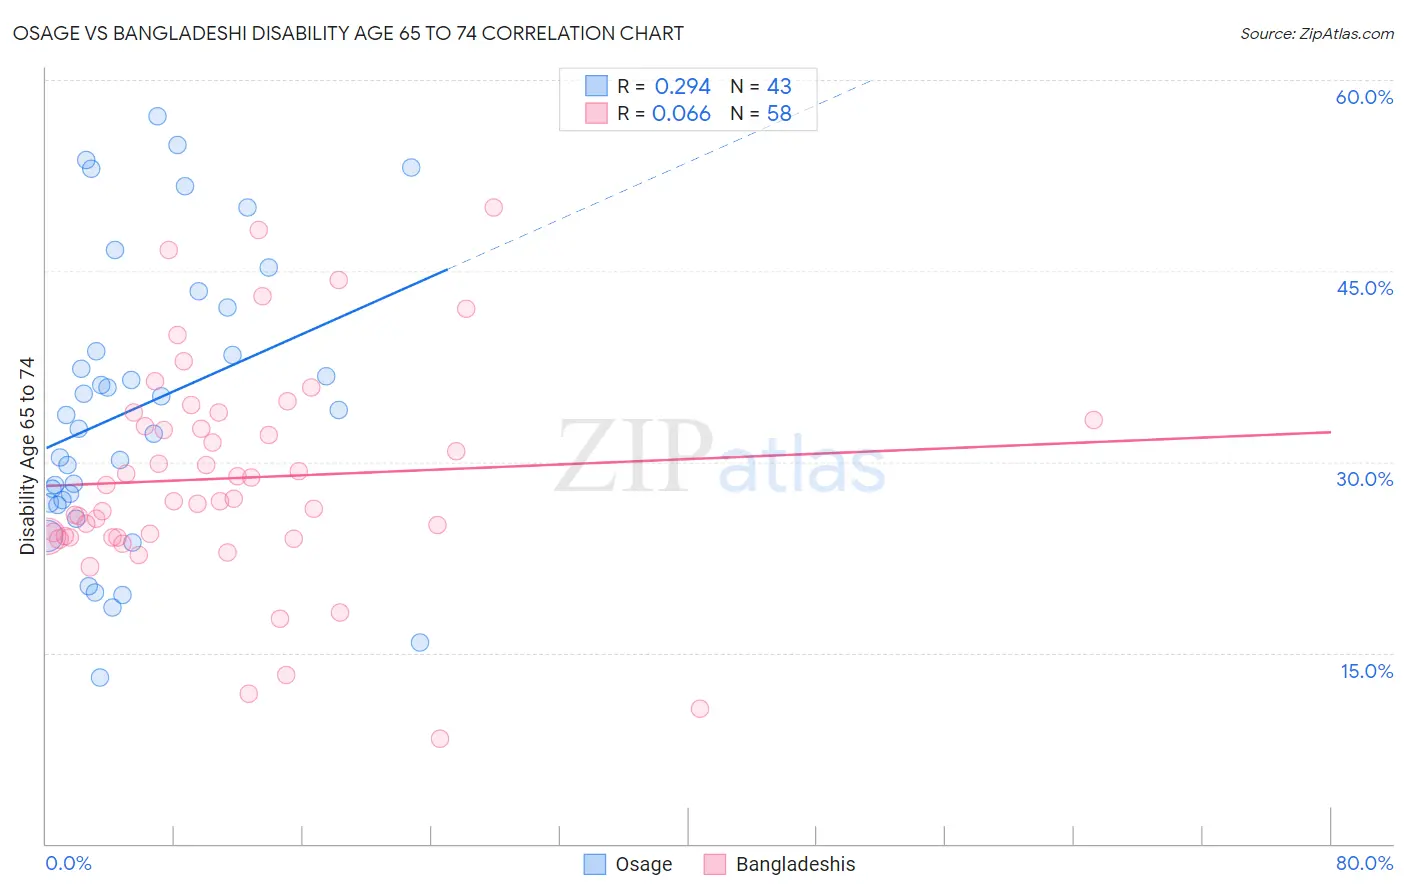
Osage vs Bangladeshi Disability Age 65 to 74 Correlation Chart
The statistical analysis conducted on geographies consisting of 91,763,527 people shows a weak positive correlation between the proportion of Osage and percentage of population with a disability between the ages 65 and 75 in the United States with a correlation coefficient (R) of 0.294 and weighted average of 27.5%. Similarly, the statistical analysis conducted on geographies consisting of 141,045,200 people shows a slight positive correlation between the proportion of Bangladeshis and percentage of population with a disability between the ages 65 and 75 in the United States with a correlation coefficient (R) of 0.066 and weighted average of 26.8%, a difference of 2.3%.
Disability Age 65 to 74 Correlation Summary
| Measurement | Osage | Bangladeshi |
| Minimum | 13.0% | 8.3% |
| Maximum | 57.1% | 50.0% |
| Range | 44.1% | 41.7% |
| Mean | 34.3% | 28.7% |
| Median | 33.7% | 27.0% |
| Interquartile 25% (IQ1) | 26.8% | 24.1% |
| Interquartile 75% (IQ3) | 42.2% | 33.3% |
| Interquartile Range (IQR) | 15.4% | 9.2% |
| Standard Deviation (Sample) | 11.3% | 8.6% |
| Standard Deviation (Population) | 11.2% | 8.5% |
Demographics Similar to Osage and Bangladeshis by Disability Age 65 to 74
In terms of disability age 65 to 74, the demographic groups most similar to Osage are Menominee (27.4%, a difference of 0.080%), Shoshone (27.4%, a difference of 0.30%), Yaqui (27.4%, a difference of 0.35%), Sioux (27.3%, a difference of 0.41%), and Ute (27.3%, a difference of 0.56%). Similarly, the demographic groups most similar to Bangladeshis are Fijian (27.0%, a difference of 0.59%), Hispanic or Latino (26.7%, a difference of 0.61%), Immigrants from Yemen (27.0%, a difference of 0.61%), Dominican (26.7%, a difference of 0.63%), and Potawatomi (27.0%, a difference of 0.64%).
| Demographics | Rating | Rank | Disability Age 65 to 74 |
| Dominicans | 0.0 /100 | #294 | Tragic 26.7% |
| Hispanics or Latinos | 0.0 /100 | #295 | Tragic 26.7% |
| Bangladeshis | 0.0 /100 | #296 | Tragic 26.8% |
| Fijians | 0.0 /100 | #297 | Tragic 27.0% |
| Immigrants | Yemen | 0.0 /100 | #298 | Tragic 27.0% |
| Potawatomi | 0.0 /100 | #299 | Tragic 27.0% |
| Immigrants | Dominican Republic | 0.0 /100 | #300 | Tragic 27.0% |
| Immigrants | Mexico | 0.0 /100 | #301 | Tragic 27.1% |
| Central American Indians | 0.0 /100 | #302 | Tragic 27.1% |
| Tlingit-Haida | 0.0 /100 | #303 | Tragic 27.1% |
| Puget Sound Salish | 0.0 /100 | #304 | Tragic 27.2% |
| Mexicans | 0.0 /100 | #305 | Tragic 27.2% |
| Blacks/African Americans | 0.0 /100 | #306 | Tragic 27.3% |
| Ute | 0.0 /100 | #307 | Tragic 27.3% |
| Sioux | 0.0 /100 | #308 | Tragic 27.3% |
| Yaqui | 0.0 /100 | #309 | Tragic 27.4% |
| Shoshone | 0.0 /100 | #310 | Tragic 27.4% |
| Menominee | 0.0 /100 | #311 | Tragic 27.4% |
| Osage | 0.0 /100 | #312 | Tragic 27.5% |
| Paiute | 0.0 /100 | #313 | Tragic 27.8% |
| Chippewa | 0.0 /100 | #314 | Tragic 27.8% |