Okinawan vs Yuman Male Disability
COMPARE
Okinawan
Yuman
Male Disability
Male Disability Comparison
Okinawans
Yuman
9.8%
MALE DISABILITY
100.0/ 100
METRIC RATING
16th/ 347
METRIC RANK
14.7%
MALE DISABILITY
0.0/ 100
METRIC RATING
333rd/ 347
METRIC RANK
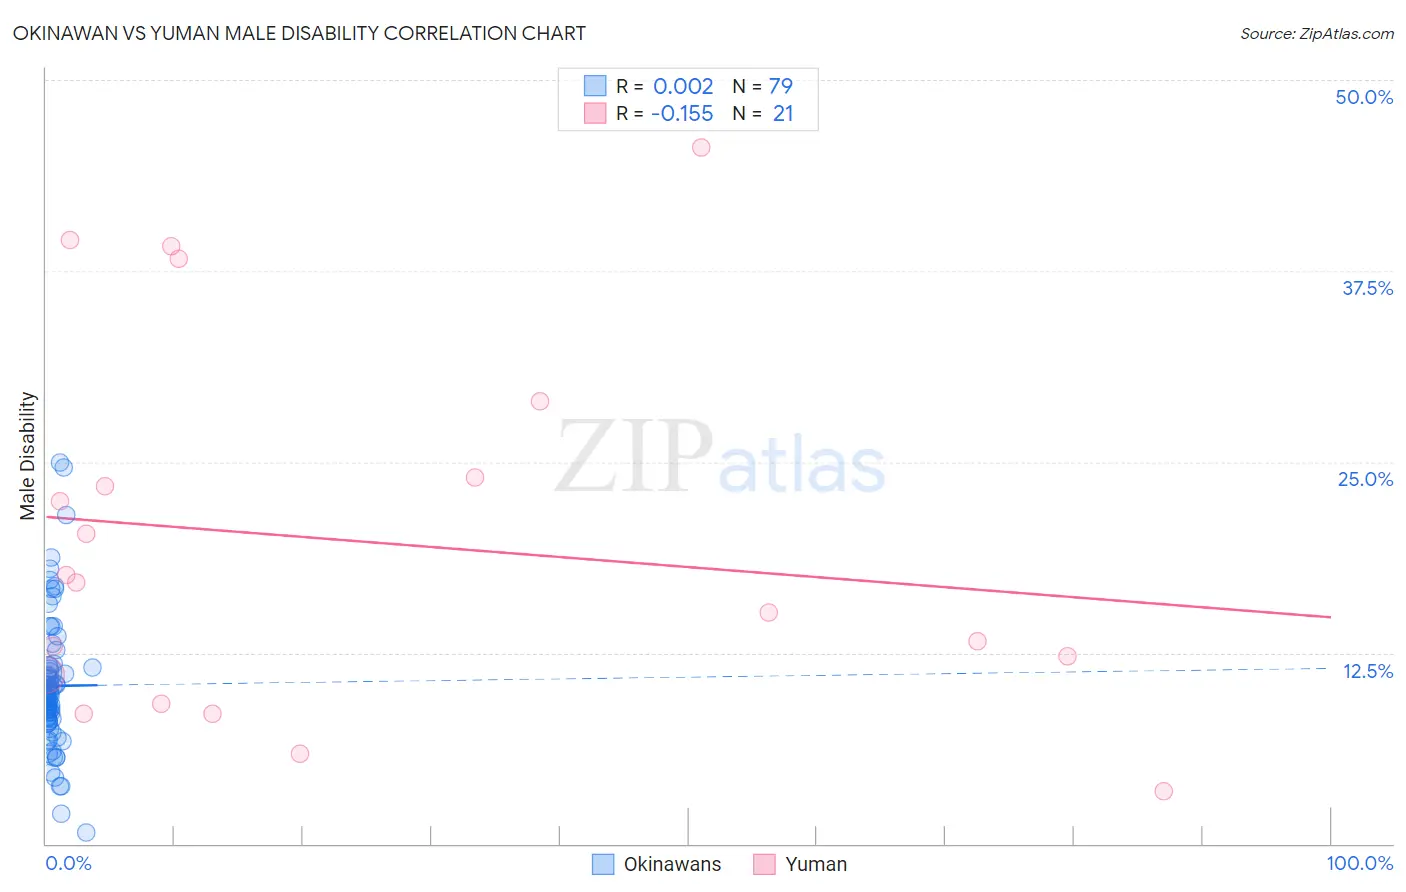
Okinawan vs Yuman Male Disability Correlation Chart
The statistical analysis conducted on geographies consisting of 73,770,513 people shows no correlation between the proportion of Okinawans and percentage of males with a disability in the United States with a correlation coefficient (R) of 0.002 and weighted average of 9.8%. Similarly, the statistical analysis conducted on geographies consisting of 40,663,251 people shows a poor negative correlation between the proportion of Yuman and percentage of males with a disability in the United States with a correlation coefficient (R) of -0.155 and weighted average of 14.7%, a difference of 50.7%.
Male Disability Correlation Summary
| Measurement | Okinawan | Yuman |
| Minimum | 0.75% | 3.4% |
| Maximum | 25.0% | 45.6% |
| Range | 24.2% | 42.1% |
| Mean | 10.3% | 19.8% |
| Median | 9.7% | 17.1% |
| Interquartile 25% (IQ1) | 8.0% | 10.1% |
| Interquartile 75% (IQ3) | 11.5% | 26.5% |
| Interquartile Range (IQR) | 3.5% | 16.4% |
| Standard Deviation (Sample) | 4.4% | 12.2% |
| Standard Deviation (Population) | 4.4% | 11.9% |
Similar Demographics by Male Disability
Demographics Similar to Okinawans by Male Disability
In terms of male disability, the demographic groups most similar to Okinawans are Immigrants from Korea (9.8%, a difference of 0.14%), Indian (Asian) (9.7%, a difference of 0.61%), Immigrants from Pakistan (9.8%, a difference of 0.70%), Immigrants from Iran (9.7%, a difference of 1.1%), and Iranian (9.7%, a difference of 1.2%).
| Demographics | Rating | Rank | Male Disability |
| Immigrants | Singapore | 100.0 /100 | #9 | Exceptional 9.5% |
| Immigrants | Israel | 100.0 /100 | #10 | Exceptional 9.6% |
| Immigrants | Eastern Asia | 100.0 /100 | #11 | Exceptional 9.6% |
| Bolivians | 100.0 /100 | #12 | Exceptional 9.6% |
| Iranians | 100.0 /100 | #13 | Exceptional 9.7% |
| Immigrants | Iran | 100.0 /100 | #14 | Exceptional 9.7% |
| Indians (Asian) | 100.0 /100 | #15 | Exceptional 9.7% |
| Okinawans | 100.0 /100 | #16 | Exceptional 9.8% |
| Immigrants | Korea | 100.0 /100 | #17 | Exceptional 9.8% |
| Immigrants | Pakistan | 100.0 /100 | #18 | Exceptional 9.8% |
| Immigrants | Sri Lanka | 100.0 /100 | #19 | Exceptional 10.0% |
| Asians | 100.0 /100 | #20 | Exceptional 10.0% |
| Burmese | 100.0 /100 | #21 | Exceptional 10.0% |
| Immigrants | Venezuela | 100.0 /100 | #22 | Exceptional 10.0% |
| Cypriots | 100.0 /100 | #23 | Exceptional 10.0% |
Demographics Similar to Yuman by Male Disability
In terms of male disability, the demographic groups most similar to Yuman are Seminole (14.7%, a difference of 0.10%), Cherokee (14.8%, a difference of 0.68%), Dutch West Indian (14.8%, a difference of 0.70%), Tohono O'odham (14.6%, a difference of 0.87%), and Alaskan Athabascan (14.9%, a difference of 1.2%).
| Demographics | Rating | Rank | Male Disability |
| Natives/Alaskans | 0.0 /100 | #326 | Tragic 14.2% |
| Potawatomi | 0.0 /100 | #327 | Tragic 14.2% |
| Chippewa | 0.0 /100 | #328 | Tragic 14.3% |
| Cajuns | 0.0 /100 | #329 | Tragic 14.4% |
| Navajo | 0.0 /100 | #330 | Tragic 14.4% |
| Tohono O'odham | 0.0 /100 | #331 | Tragic 14.6% |
| Seminole | 0.0 /100 | #332 | Tragic 14.7% |
| Yuman | 0.0 /100 | #333 | Tragic 14.7% |
| Cherokee | 0.0 /100 | #334 | Tragic 14.8% |
| Dutch West Indians | 0.0 /100 | #335 | Tragic 14.8% |
| Alaskan Athabascans | 0.0 /100 | #336 | Tragic 14.9% |
| Menominee | 0.0 /100 | #337 | Tragic 15.0% |
| Pueblo | 0.0 /100 | #338 | Tragic 15.0% |
| Chickasaw | 0.0 /100 | #339 | Tragic 15.1% |
| Lumbee | 0.0 /100 | #340 | Tragic 15.2% |