Okinawan vs Paraguayan Vision Disability
COMPARE
Okinawan
Paraguayan
Vision Disability
Vision Disability Comparison
Okinawans
Paraguayans
1.8%
VISION DISABILITY
100.0/ 100
METRIC RATING
5th/ 347
METRIC RANK
2.0%
VISION DISABILITY
98.3/ 100
METRIC RATING
76th/ 347
METRIC RANK
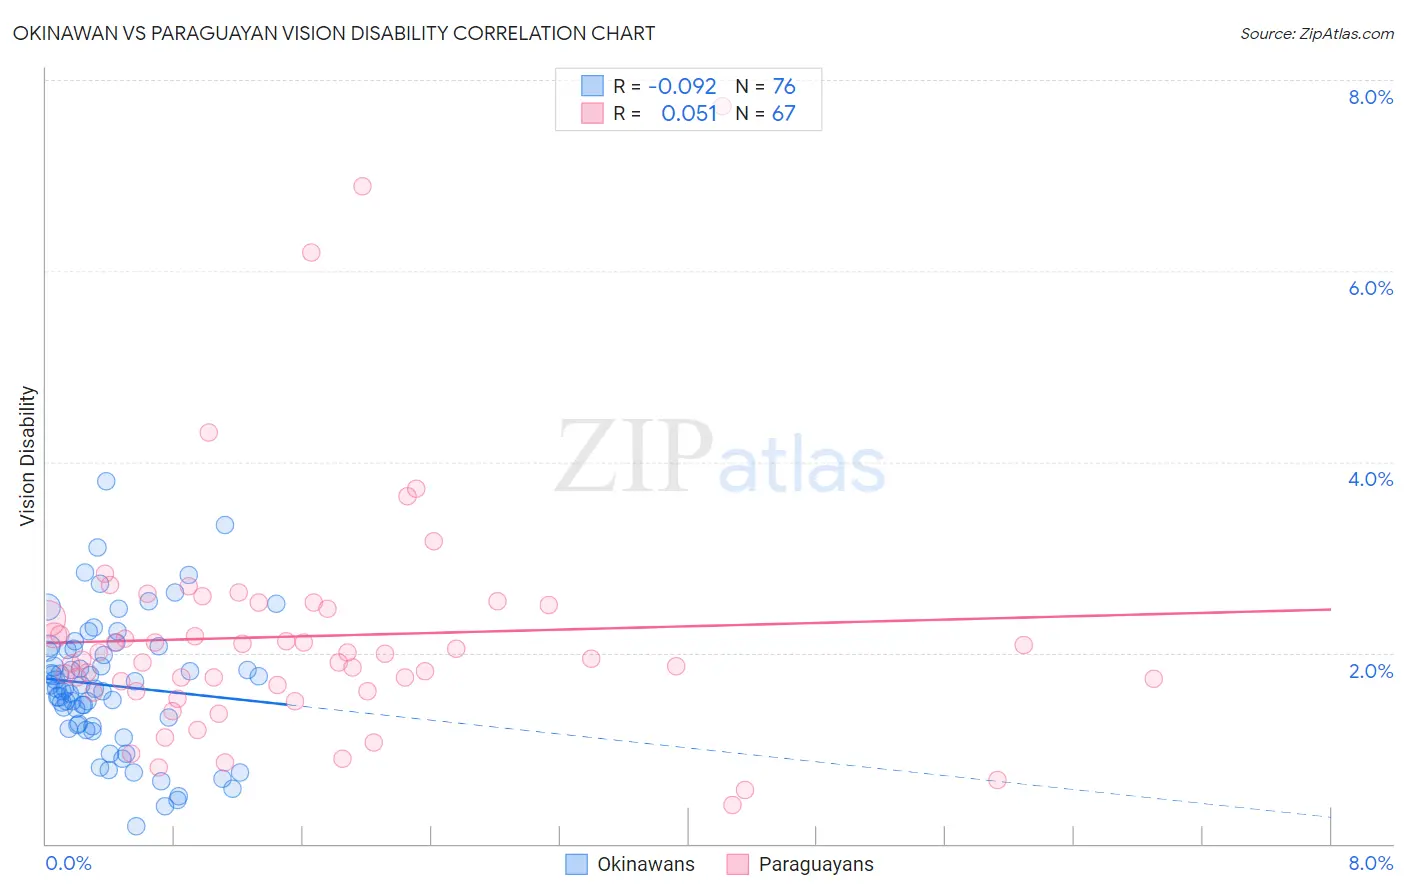
Okinawan vs Paraguayan Vision Disability Correlation Chart
The statistical analysis conducted on geographies consisting of 73,755,744 people shows a slight negative correlation between the proportion of Okinawans and percentage of population with vision disability in the United States with a correlation coefficient (R) of -0.092 and weighted average of 1.8%. Similarly, the statistical analysis conducted on geographies consisting of 95,099,644 people shows a slight positive correlation between the proportion of Paraguayans and percentage of population with vision disability in the United States with a correlation coefficient (R) of 0.051 and weighted average of 2.0%, a difference of 14.3%.
Vision Disability Correlation Summary
| Measurement | Okinawan | Paraguayan |
| Minimum | 0.19% | 0.41% |
| Maximum | 3.8% | 7.7% |
| Range | 3.6% | 7.3% |
| Mean | 1.7% | 2.2% |
| Median | 1.6% | 1.9% |
| Interquartile 25% (IQ1) | 1.2% | 1.6% |
| Interquartile 75% (IQ3) | 2.0% | 2.5% |
| Interquartile Range (IQR) | 0.80% | 0.90% |
| Standard Deviation (Sample) | 0.69% | 1.3% |
| Standard Deviation (Population) | 0.69% | 1.3% |
Similar Demographics by Vision Disability
Demographics Similar to Okinawans by Vision Disability
In terms of vision disability, the demographic groups most similar to Okinawans are Immigrants from Iran (1.8%, a difference of 0.59%), Immigrants from South Central Asia (1.8%, a difference of 0.65%), Iranian (1.8%, a difference of 0.80%), Immigrants from Singapore (1.8%, a difference of 1.5%), and Immigrants from Hong Kong (1.8%, a difference of 1.7%).
| Demographics | Rating | Rank | Vision Disability |
| Immigrants | India | 100.0 /100 | #1 | Exceptional 1.7% |
| Filipinos | 100.0 /100 | #2 | Exceptional 1.7% |
| Immigrants | Taiwan | 100.0 /100 | #3 | Exceptional 1.7% |
| Thais | 100.0 /100 | #4 | Exceptional 1.7% |
| Okinawans | 100.0 /100 | #5 | Exceptional 1.8% |
| Immigrants | Iran | 100.0 /100 | #6 | Exceptional 1.8% |
| Immigrants | South Central Asia | 100.0 /100 | #7 | Exceptional 1.8% |
| Iranians | 100.0 /100 | #8 | Exceptional 1.8% |
| Immigrants | Singapore | 100.0 /100 | #9 | Exceptional 1.8% |
| Immigrants | Hong Kong | 100.0 /100 | #10 | Exceptional 1.8% |
| Immigrants | Israel | 100.0 /100 | #11 | Exceptional 1.8% |
| Immigrants | Korea | 100.0 /100 | #12 | Exceptional 1.8% |
| Immigrants | Eastern Asia | 100.0 /100 | #13 | Exceptional 1.8% |
| Immigrants | China | 100.0 /100 | #14 | Exceptional 1.8% |
| Immigrants | Bolivia | 100.0 /100 | #15 | Exceptional 1.8% |
Demographics Similar to Paraguayans by Vision Disability
In terms of vision disability, the demographic groups most similar to Paraguayans are Immigrants from Jordan (2.0%, a difference of 0.0%), Palestinian (2.0%, a difference of 0.020%), Immigrants from North Macedonia (2.0%, a difference of 0.020%), Immigrants from Eastern Europe (2.0%, a difference of 0.030%), and Immigrants from Eritrea (2.0%, a difference of 0.070%).
| Demographics | Rating | Rank | Vision Disability |
| Russians | 98.6 /100 | #69 | Exceptional 2.0% |
| Immigrants | Kazakhstan | 98.6 /100 | #70 | Exceptional 2.0% |
| Immigrants | Northern Europe | 98.6 /100 | #71 | Exceptional 2.0% |
| Immigrants | France | 98.5 /100 | #72 | Exceptional 2.0% |
| Immigrants | Eritrea | 98.4 /100 | #73 | Exceptional 2.0% |
| Palestinians | 98.3 /100 | #74 | Exceptional 2.0% |
| Immigrants | North Macedonia | 98.3 /100 | #75 | Exceptional 2.0% |
| Paraguayans | 98.3 /100 | #76 | Exceptional 2.0% |
| Immigrants | Jordan | 98.3 /100 | #77 | Exceptional 2.0% |
| Immigrants | Eastern Europe | 98.3 /100 | #78 | Exceptional 2.0% |
| Assyrians/Chaldeans/Syriacs | 98.1 /100 | #79 | Exceptional 2.0% |
| Lithuanians | 97.7 /100 | #80 | Exceptional 2.0% |
| Soviet Union | 97.6 /100 | #81 | Exceptional 2.0% |
| Immigrants | Poland | 97.6 /100 | #82 | Exceptional 2.0% |
| Immigrants | Western Asia | 97.5 /100 | #83 | Exceptional 2.0% |