Okinawan vs Israeli Disability Age 65 to 74
COMPARE
Okinawan
Israeli
Disability Age 65 to 74
Disability Age 65 to 74 Comparison
Okinawans
Israelis
20.7%
DISABILITY AGE 65 TO 74
100.0/ 100
METRIC RATING
20th/ 347
METRIC RANK
21.2%
DISABILITY AGE 65 TO 74
99.8/ 100
METRIC RATING
37th/ 347
METRIC RANK
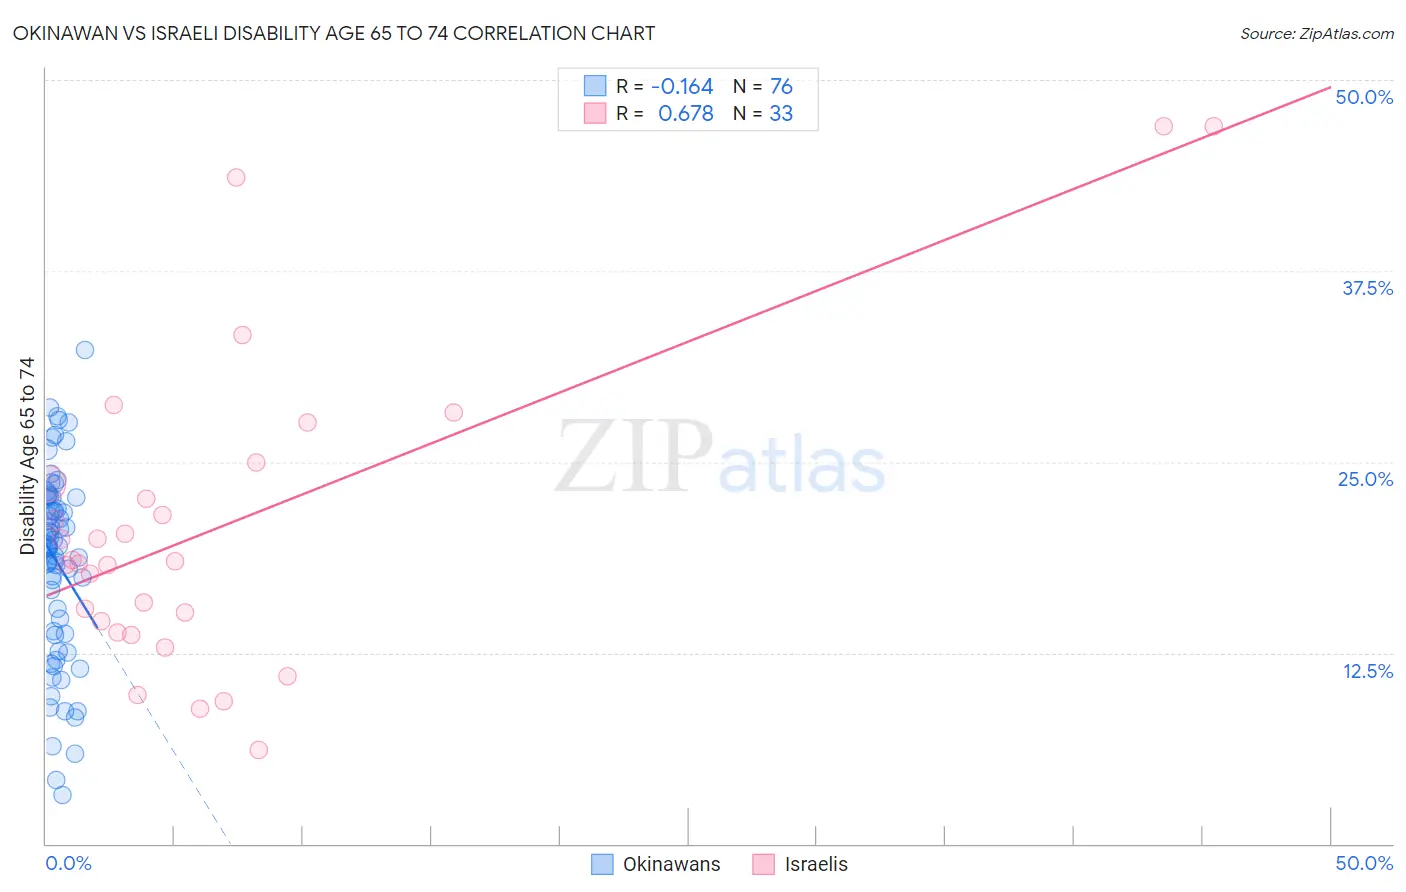
Okinawan vs Israeli Disability Age 65 to 74 Correlation Chart
The statistical analysis conducted on geographies consisting of 73,634,588 people shows a poor negative correlation between the proportion of Okinawans and percentage of population with a disability between the ages 65 and 75 in the United States with a correlation coefficient (R) of -0.164 and weighted average of 20.7%. Similarly, the statistical analysis conducted on geographies consisting of 210,778,329 people shows a significant positive correlation between the proportion of Israelis and percentage of population with a disability between the ages 65 and 75 in the United States with a correlation coefficient (R) of 0.678 and weighted average of 21.2%, a difference of 2.3%.
Disability Age 65 to 74 Correlation Summary
| Measurement | Okinawan | Israeli |
| Minimum | 3.2% | 6.1% |
| Maximum | 32.4% | 46.9% |
| Range | 29.1% | 40.8% |
| Mean | 18.4% | 20.8% |
| Median | 19.5% | 18.5% |
| Interquartile 25% (IQ1) | 13.8% | 14.2% |
| Interquartile 75% (IQ3) | 22.7% | 24.3% |
| Interquartile Range (IQR) | 8.8% | 10.1% |
| Standard Deviation (Sample) | 6.2% | 10.1% |
| Standard Deviation (Population) | 6.1% | 10.0% |
Demographics Similar to Okinawans and Israelis by Disability Age 65 to 74
In terms of disability age 65 to 74, the demographic groups most similar to Okinawans are Burmese (20.6%, a difference of 0.32%), Eastern European (20.6%, a difference of 0.35%), Immigrants from Bolivia (20.8%, a difference of 0.74%), Immigrants from Iran (20.9%, a difference of 0.97%), and Immigrants from Belgium (21.0%, a difference of 1.3%). Similarly, the demographic groups most similar to Israelis are Russian (21.2%, a difference of 0.0%), Immigrants from Switzerland (21.1%, a difference of 0.11%), Bulgarian (21.1%, a difference of 0.30%), Immigrants from Sri Lanka (21.1%, a difference of 0.36%), and Immigrants from Argentina (21.1%, a difference of 0.39%).
| Demographics | Rating | Rank | Disability Age 65 to 74 |
| Eastern Europeans | 100.0 /100 | #18 | Exceptional 20.6% |
| Burmese | 100.0 /100 | #19 | Exceptional 20.6% |
| Okinawans | 100.0 /100 | #20 | Exceptional 20.7% |
| Immigrants | Bolivia | 99.9 /100 | #21 | Exceptional 20.8% |
| Immigrants | Iran | 99.9 /100 | #22 | Exceptional 20.9% |
| Immigrants | Belgium | 99.9 /100 | #23 | Exceptional 21.0% |
| Soviet Union | 99.9 /100 | #24 | Exceptional 21.0% |
| Bolivians | 99.9 /100 | #25 | Exceptional 21.0% |
| Immigrants | Australia | 99.9 /100 | #26 | Exceptional 21.0% |
| Immigrants | Sweden | 99.9 /100 | #27 | Exceptional 21.0% |
| Immigrants | Czechoslovakia | 99.9 /100 | #28 | Exceptional 21.0% |
| Immigrants | Japan | 99.9 /100 | #29 | Exceptional 21.0% |
| Immigrants | Greece | 99.9 /100 | #30 | Exceptional 21.0% |
| Immigrants | Northern Europe | 99.9 /100 | #31 | Exceptional 21.0% |
| Turks | 99.9 /100 | #32 | Exceptional 21.0% |
| Immigrants | Argentina | 99.9 /100 | #33 | Exceptional 21.1% |
| Immigrants | Sri Lanka | 99.9 /100 | #34 | Exceptional 21.1% |
| Bulgarians | 99.9 /100 | #35 | Exceptional 21.1% |
| Immigrants | Switzerland | 99.8 /100 | #36 | Exceptional 21.1% |
| Israelis | 99.8 /100 | #37 | Exceptional 21.2% |
| Russians | 99.8 /100 | #38 | Exceptional 21.2% |