Norwegian vs Tsimshian Disability Age Over 75
COMPARE
Norwegian
Tsimshian
Disability Age Over 75
Disability Age Over 75 Comparison
Norwegians
Tsimshian
45.5%
DISABILITY AGE OVER 75
99.9/ 100
METRIC RATING
35th/ 347
METRIC RANK
59.2%
DISABILITY AGE OVER 75
0.0/ 100
METRIC RATING
346th/ 347
METRIC RANK
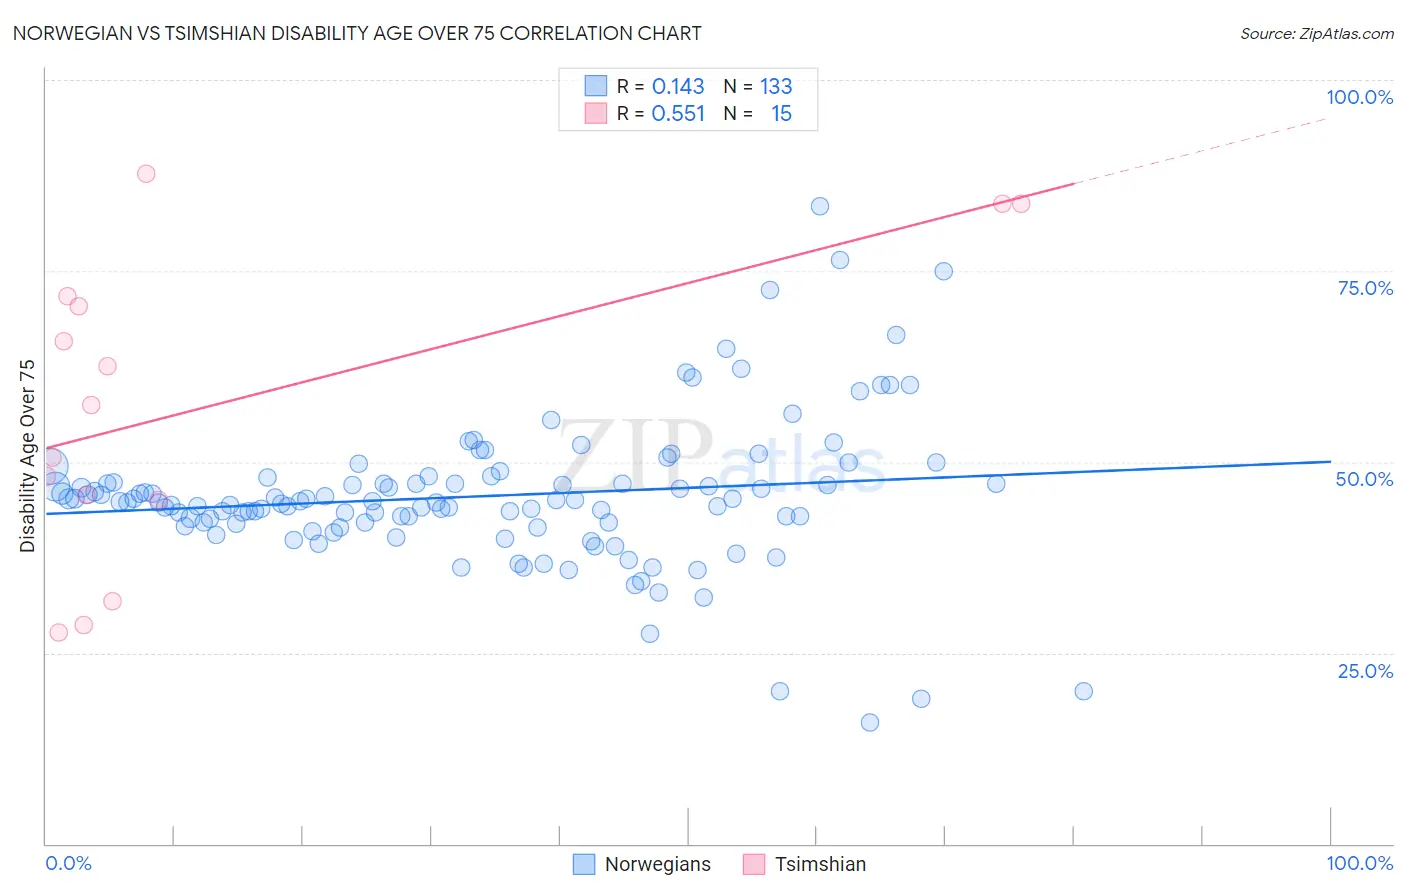
Norwegian vs Tsimshian Disability Age Over 75 Correlation Chart
The statistical analysis conducted on geographies consisting of 531,659,675 people shows a poor positive correlation between the proportion of Norwegians and percentage of population with a disability over the age of 75 in the United States with a correlation coefficient (R) of 0.143 and weighted average of 45.5%. Similarly, the statistical analysis conducted on geographies consisting of 15,620,176 people shows a substantial positive correlation between the proportion of Tsimshian and percentage of population with a disability over the age of 75 in the United States with a correlation coefficient (R) of 0.551 and weighted average of 59.2%, a difference of 30.1%.
Disability Age Over 75 Correlation Summary
| Measurement | Norwegian | Tsimshian |
| Minimum | 15.8% | 27.7% |
| Maximum | 83.4% | 87.8% |
| Range | 67.6% | 60.1% |
| Mean | 45.5% | 57.4% |
| Median | 44.8% | 57.4% |
| Interquartile 25% (IQ1) | 42.0% | 45.0% |
| Interquartile 75% (IQ3) | 47.2% | 71.6% |
| Interquartile Range (IQR) | 5.2% | 26.6% |
| Standard Deviation (Sample) | 9.6% | 20.0% |
| Standard Deviation (Population) | 9.6% | 19.3% |
Similar Demographics by Disability Age Over 75
Demographics Similar to Norwegians by Disability Age Over 75
In terms of disability age over 75, the demographic groups most similar to Norwegians are Russian (45.5%, a difference of 0.010%), Immigrants from Taiwan (45.5%, a difference of 0.030%), South African (45.5%, a difference of 0.030%), Immigrants from Croatia (45.5%, a difference of 0.040%), and Italian (45.6%, a difference of 0.090%).
| Demographics | Rating | Rank | Disability Age Over 75 |
| Thais | 99.9 /100 | #28 | Exceptional 45.4% |
| Filipinos | 99.9 /100 | #29 | Exceptional 45.4% |
| Immigrants | Denmark | 99.9 /100 | #30 | Exceptional 45.4% |
| Immigrants | Bulgaria | 99.9 /100 | #31 | Exceptional 45.5% |
| Immigrants | Australia | 99.9 /100 | #32 | Exceptional 45.5% |
| Immigrants | Croatia | 99.9 /100 | #33 | Exceptional 45.5% |
| Russians | 99.9 /100 | #34 | Exceptional 45.5% |
| Norwegians | 99.9 /100 | #35 | Exceptional 45.5% |
| Immigrants | Taiwan | 99.9 /100 | #36 | Exceptional 45.5% |
| South Africans | 99.9 /100 | #37 | Exceptional 45.5% |
| Italians | 99.9 /100 | #38 | Exceptional 45.6% |
| Estonians | 99.9 /100 | #39 | Exceptional 45.6% |
| Slovenes | 99.9 /100 | #40 | Exceptional 45.6% |
| Immigrants | Singapore | 99.8 /100 | #41 | Exceptional 45.6% |
| Greeks | 99.8 /100 | #42 | Exceptional 45.6% |
Demographics Similar to Tsimshian by Disability Age Over 75
In terms of disability age over 75, the demographic groups most similar to Tsimshian are Inupiat (58.4%, a difference of 1.4%), Navajo (58.3%, a difference of 1.6%), Yup'ik (61.1%, a difference of 3.2%), Tohono O'odham (56.7%, a difference of 4.4%), and Lumbee (56.2%, a difference of 5.3%).
| Demographics | Rating | Rank | Disability Age Over 75 |
| Apache | 0.0 /100 | #333 | Tragic 53.6% |
| Alaskan Athabascans | 0.0 /100 | #334 | Tragic 54.0% |
| Kiowa | 0.0 /100 | #335 | Tragic 54.2% |
| Immigrants | Armenia | 0.0 /100 | #336 | Tragic 54.3% |
| Yuman | 0.0 /100 | #337 | Tragic 54.4% |
| Colville | 0.0 /100 | #338 | Tragic 55.4% |
| Pima | 0.0 /100 | #339 | Tragic 55.8% |
| Pueblo | 0.0 /100 | #340 | Tragic 55.9% |
| Houma | 0.0 /100 | #341 | Tragic 56.2% |
| Lumbee | 0.0 /100 | #342 | Tragic 56.2% |
| Tohono O'odham | 0.0 /100 | #343 | Tragic 56.7% |
| Navajo | 0.0 /100 | #344 | Tragic 58.3% |
| Inupiat | 0.0 /100 | #345 | Tragic 58.4% |
| Tsimshian | 0.0 /100 | #346 | Tragic 59.2% |
| Yup'ik | 0.0 /100 | #347 | Tragic 61.1% |