Norwegian vs Palestinian Vision Disability
COMPARE
Norwegian
Palestinian
Vision Disability
Vision Disability Comparison
Norwegians
Palestinians
2.0%
VISION DISABILITY
97.0/ 100
METRIC RATING
88th/ 347
METRIC RANK
2.0%
VISION DISABILITY
98.3/ 100
METRIC RATING
74th/ 347
METRIC RANK
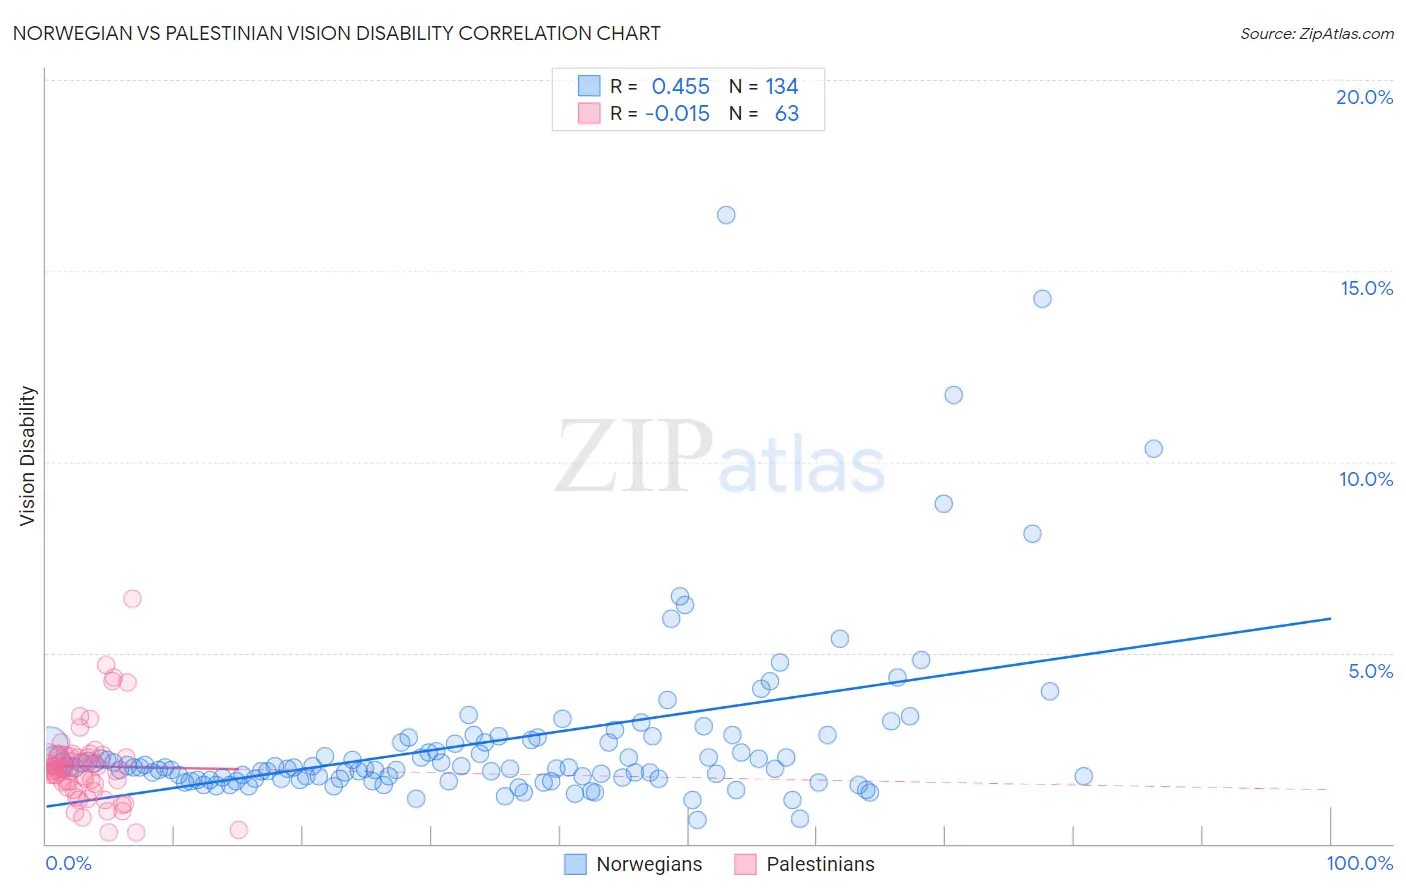
Norwegian vs Palestinian Vision Disability Correlation Chart
The statistical analysis conducted on geographies consisting of 532,008,287 people shows a moderate positive correlation between the proportion of Norwegians and percentage of population with vision disability in the United States with a correlation coefficient (R) of 0.455 and weighted average of 2.0%. Similarly, the statistical analysis conducted on geographies consisting of 216,427,848 people shows no correlation between the proportion of Palestinians and percentage of population with vision disability in the United States with a correlation coefficient (R) of -0.015 and weighted average of 2.0%, a difference of 0.97%.
Vision Disability Correlation Summary
| Measurement | Norwegian | Palestinian |
| Minimum | 0.63% | 0.30% |
| Maximum | 16.5% | 6.4% |
| Range | 15.8% | 6.1% |
| Mean | 2.7% | 2.0% |
| Median | 2.0% | 1.9% |
| Interquartile 25% (IQ1) | 1.7% | 1.5% |
| Interquartile 75% (IQ3) | 2.7% | 2.3% |
| Interquartile Range (IQR) | 0.95% | 0.81% |
| Standard Deviation (Sample) | 2.3% | 1.1% |
| Standard Deviation (Population) | 2.3% | 1.1% |
Demographics Similar to Norwegians and Palestinians by Vision Disability
In terms of vision disability, the demographic groups most similar to Norwegians are Immigrants from Switzerland (2.0%, a difference of 0.010%), Immigrants from Eastern Africa (2.0%, a difference of 0.040%), Immigrants from Moldova (2.0%, a difference of 0.070%), Chinese (2.0%, a difference of 0.10%), and Immigrants from Latvia (2.0%, a difference of 0.15%). Similarly, the demographic groups most similar to Palestinians are Immigrants from North Macedonia (2.0%, a difference of 0.0%), Paraguayan (2.0%, a difference of 0.020%), Immigrants from Jordan (2.0%, a difference of 0.020%), Immigrants from Eritrea (2.0%, a difference of 0.050%), and Immigrants from Eastern Europe (2.0%, a difference of 0.050%).
| Demographics | Rating | Rank | Vision Disability |
| Immigrants | Northern Europe | 98.6 /100 | #71 | Exceptional 2.0% |
| Immigrants | France | 98.5 /100 | #72 | Exceptional 2.0% |
| Immigrants | Eritrea | 98.4 /100 | #73 | Exceptional 2.0% |
| Palestinians | 98.3 /100 | #74 | Exceptional 2.0% |
| Immigrants | North Macedonia | 98.3 /100 | #75 | Exceptional 2.0% |
| Paraguayans | 98.3 /100 | #76 | Exceptional 2.0% |
| Immigrants | Jordan | 98.3 /100 | #77 | Exceptional 2.0% |
| Immigrants | Eastern Europe | 98.3 /100 | #78 | Exceptional 2.0% |
| Assyrians/Chaldeans/Syriacs | 98.1 /100 | #79 | Exceptional 2.0% |
| Lithuanians | 97.7 /100 | #80 | Exceptional 2.0% |
| Soviet Union | 97.6 /100 | #81 | Exceptional 2.0% |
| Immigrants | Poland | 97.6 /100 | #82 | Exceptional 2.0% |
| Immigrants | Western Asia | 97.5 /100 | #83 | Exceptional 2.0% |
| Immigrants | Latvia | 97.3 /100 | #84 | Exceptional 2.0% |
| Chinese | 97.2 /100 | #85 | Exceptional 2.0% |
| Immigrants | Moldova | 97.2 /100 | #86 | Exceptional 2.0% |
| Immigrants | Switzerland | 97.0 /100 | #87 | Exceptional 2.0% |
| Norwegians | 97.0 /100 | #88 | Exceptional 2.0% |
| Immigrants | Eastern Africa | 97.0 /100 | #89 | Exceptional 2.0% |
| Immigrants | Lebanon | 96.7 /100 | #90 | Exceptional 2.1% |
| Immigrants | Somalia | 96.2 /100 | #91 | Exceptional 2.1% |