Northern European vs Houma Ambulatory Disability
COMPARE
Northern European
Houma
Ambulatory Disability
Ambulatory Disability Comparison
Northern Europeans
Houma
6.0%
AMBULATORY DISABILITY
71.8/ 100
METRIC RATING
156th/ 347
METRIC RANK
9.3%
AMBULATORY DISABILITY
0.0/ 100
METRIC RATING
346th/ 347
METRIC RANK
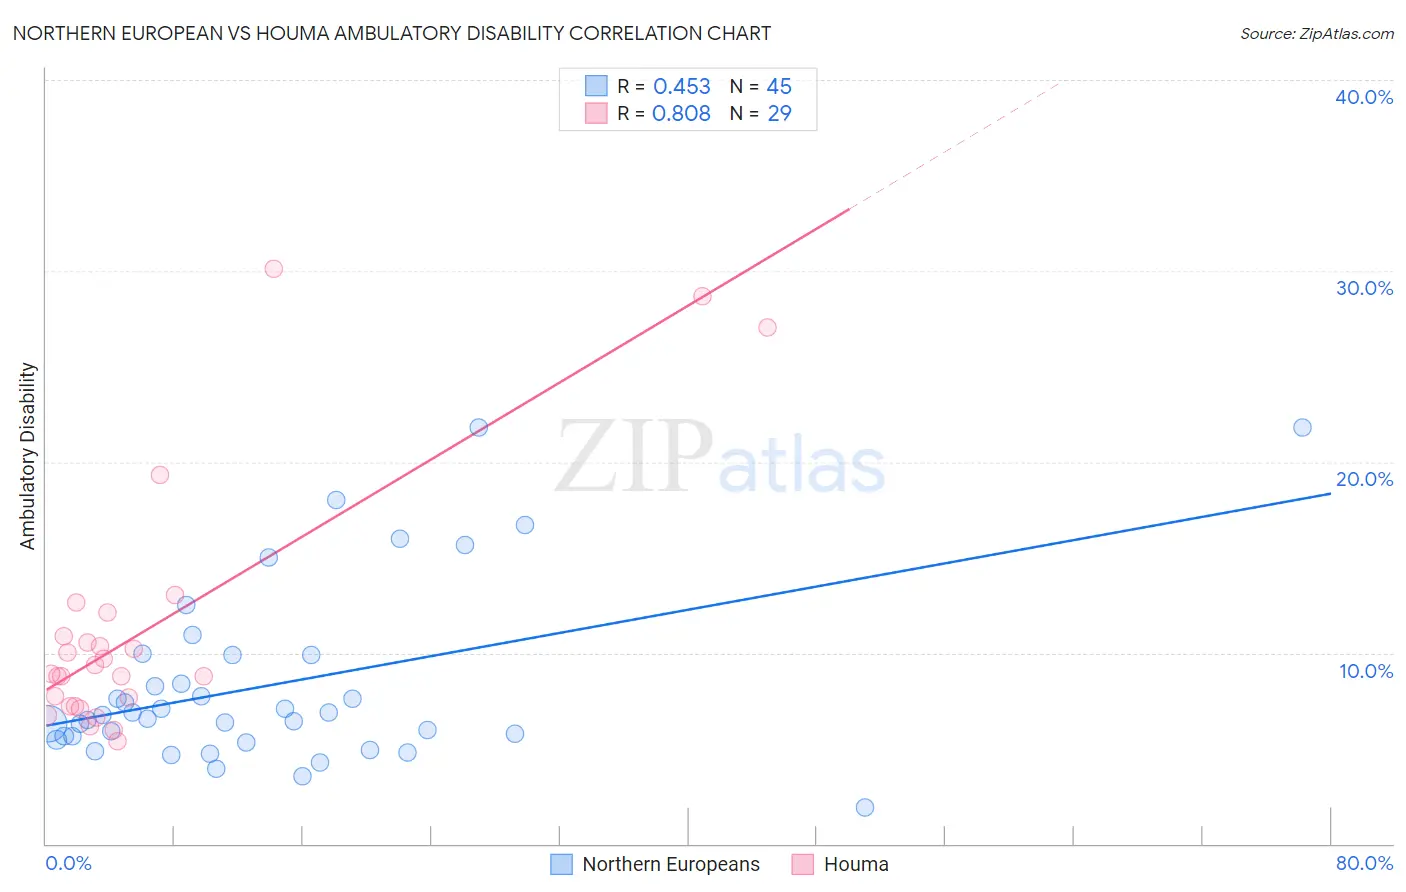
Northern European vs Houma Ambulatory Disability Correlation Chart
The statistical analysis conducted on geographies consisting of 405,984,398 people shows a moderate positive correlation between the proportion of Northern Europeans and percentage of population with ambulatory disability in the United States with a correlation coefficient (R) of 0.453 and weighted average of 6.0%. Similarly, the statistical analysis conducted on geographies consisting of 36,798,241 people shows a very strong positive correlation between the proportion of Houma and percentage of population with ambulatory disability in the United States with a correlation coefficient (R) of 0.808 and weighted average of 9.3%, a difference of 54.0%.
Ambulatory Disability Correlation Summary
| Measurement | Northern European | Houma |
| Minimum | 1.9% | 5.4% |
| Maximum | 21.8% | 30.1% |
| Range | 19.9% | 24.8% |
| Mean | 8.3% | 11.2% |
| Median | 6.7% | 8.9% |
| Interquartile 25% (IQ1) | 5.5% | 7.2% |
| Interquartile 75% (IQ3) | 9.9% | 11.5% |
| Interquartile Range (IQR) | 4.3% | 4.3% |
| Standard Deviation (Sample) | 4.7% | 6.6% |
| Standard Deviation (Population) | 4.6% | 6.5% |
Similar Demographics by Ambulatory Disability
Demographics Similar to Northern Europeans by Ambulatory Disability
In terms of ambulatory disability, the demographic groups most similar to Northern Europeans are Immigrants from Scotland (6.0%, a difference of 0.020%), Ghanaian (6.0%, a difference of 0.030%), Immigrants from Fiji (6.0%, a difference of 0.050%), Immigrants from Latvia (6.0%, a difference of 0.050%), and Central American (6.0%, a difference of 0.13%).
| Demographics | Rating | Rank | Ambulatory Disability |
| Lithuanians | 81.9 /100 | #149 | Excellent 6.0% |
| Maltese | 81.6 /100 | #150 | Excellent 6.0% |
| Greeks | 79.6 /100 | #151 | Good 6.0% |
| Immigrants | Austria | 78.8 /100 | #152 | Good 6.0% |
| Syrians | 75.5 /100 | #153 | Good 6.0% |
| Immigrants | Croatia | 75.1 /100 | #154 | Good 6.0% |
| Immigrants | Scotland | 72.1 /100 | #155 | Good 6.0% |
| Northern Europeans | 71.8 /100 | #156 | Good 6.0% |
| Ghanaians | 71.3 /100 | #157 | Good 6.0% |
| Immigrants | Fiji | 71.2 /100 | #158 | Good 6.0% |
| Immigrants | Latvia | 71.1 /100 | #159 | Good 6.0% |
| Central Americans | 69.8 /100 | #160 | Good 6.0% |
| Immigrants | Belarus | 69.2 /100 | #161 | Good 6.1% |
| Nigerians | 67.1 /100 | #162 | Good 6.1% |
| Lebanese | 66.2 /100 | #163 | Good 6.1% |
Demographics Similar to Houma by Ambulatory Disability
In terms of ambulatory disability, the demographic groups most similar to Houma are Lumbee (9.5%, a difference of 2.5%), Puerto Rican (8.9%, a difference of 4.9%), Tsimshian (8.8%, a difference of 5.5%), Tohono O'odham (8.7%, a difference of 6.5%), and Kiowa (8.6%, a difference of 8.1%).
| Demographics | Rating | Rank | Ambulatory Disability |
| Cherokee | 0.0 /100 | #333 | Tragic 7.9% |
| Yuman | 0.0 /100 | #334 | Tragic 7.9% |
| Chickasaw | 0.0 /100 | #335 | Tragic 8.0% |
| Seminole | 0.0 /100 | #336 | Tragic 8.0% |
| Dutch West Indians | 0.0 /100 | #337 | Tragic 8.2% |
| Colville | 0.0 /100 | #338 | Tragic 8.2% |
| Pima | 0.0 /100 | #339 | Tragic 8.2% |
| Choctaw | 0.0 /100 | #340 | Tragic 8.3% |
| Creek | 0.0 /100 | #341 | Tragic 8.5% |
| Kiowa | 0.0 /100 | #342 | Tragic 8.6% |
| Tohono O'odham | 0.0 /100 | #343 | Tragic 8.7% |
| Tsimshian | 0.0 /100 | #344 | Tragic 8.8% |
| Puerto Ricans | 0.0 /100 | #345 | Tragic 8.9% |
| Houma | 0.0 /100 | #346 | Tragic 9.3% |
| Lumbee | 0.0 /100 | #347 | Tragic 9.5% |