Nigerian vs Colombian Disability Age Over 75
COMPARE
Nigerian
Colombian
Disability Age Over 75
Disability Age Over 75 Comparison
Nigerians
Colombians
47.7%
DISABILITY AGE OVER 75
19.2/ 100
METRIC RATING
204th/ 347
METRIC RANK
46.7%
DISABILITY AGE OVER 75
91.3/ 100
METRIC RATING
125th/ 347
METRIC RANK
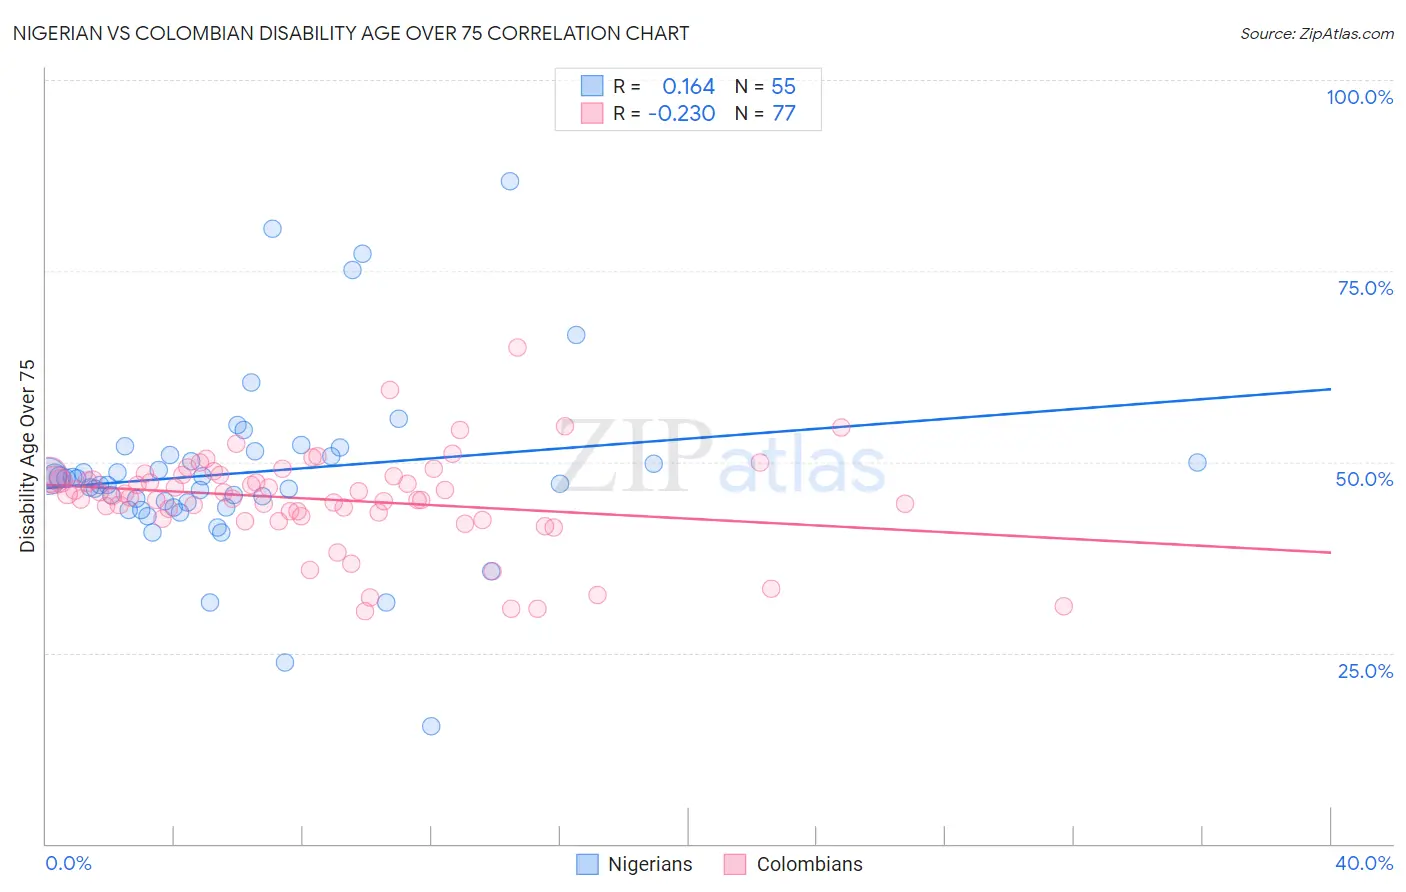
Nigerian vs Colombian Disability Age Over 75 Correlation Chart
The statistical analysis conducted on geographies consisting of 331,999,624 people shows a poor positive correlation between the proportion of Nigerians and percentage of population with a disability over the age of 75 in the United States with a correlation coefficient (R) of 0.164 and weighted average of 47.7%. Similarly, the statistical analysis conducted on geographies consisting of 418,613,267 people shows a weak negative correlation between the proportion of Colombians and percentage of population with a disability over the age of 75 in the United States with a correlation coefficient (R) of -0.230 and weighted average of 46.7%, a difference of 2.1%.
Disability Age Over 75 Correlation Summary
| Measurement | Nigerian | Colombian |
| Minimum | 15.5% | 30.4% |
| Maximum | 86.8% | 65.0% |
| Range | 71.3% | 34.6% |
| Mean | 48.6% | 45.1% |
| Median | 47.8% | 45.8% |
| Interquartile 25% (IQ1) | 44.0% | 43.1% |
| Interquartile 75% (IQ3) | 50.9% | 48.3% |
| Interquartile Range (IQR) | 6.8% | 5.1% |
| Standard Deviation (Sample) | 11.8% | 6.2% |
| Standard Deviation (Population) | 11.7% | 6.2% |
Similar Demographics by Disability Age Over 75
Demographics Similar to Nigerians by Disability Age Over 75
In terms of disability age over 75, the demographic groups most similar to Nigerians are Immigrants from Ghana (47.7%, a difference of 0.010%), Jamaican (47.7%, a difference of 0.010%), Trinidadian and Tobagonian (47.7%, a difference of 0.030%), Immigrants from Bahamas (47.7%, a difference of 0.050%), and Immigrants from Cuba (47.7%, a difference of 0.060%).
| Demographics | Rating | Rank | Disability Age Over 75 |
| Pakistanis | 23.4 /100 | #197 | Fair 47.7% |
| Immigrants | Ukraine | 23.2 /100 | #198 | Fair 47.7% |
| Immigrants | Eritrea | 22.4 /100 | #199 | Fair 47.7% |
| Immigrants | Somalia | 21.4 /100 | #200 | Fair 47.7% |
| Immigrants | Cuba | 20.9 /100 | #201 | Fair 47.7% |
| Immigrants | Bahamas | 20.7 /100 | #202 | Fair 47.7% |
| Trinidadians and Tobagonians | 20.0 /100 | #203 | Fair 47.7% |
| Nigerians | 19.2 /100 | #204 | Poor 47.7% |
| Immigrants | Ghana | 19.1 /100 | #205 | Poor 47.7% |
| Jamaicans | 19.0 /100 | #206 | Poor 47.7% |
| Immigrants | Syria | 17.4 /100 | #207 | Poor 47.8% |
| Immigrants | Senegal | 16.9 /100 | #208 | Poor 47.8% |
| Immigrants | Indonesia | 14.2 /100 | #209 | Poor 47.8% |
| Vietnamese | 11.9 /100 | #210 | Poor 47.9% |
| Panamanians | 11.8 /100 | #211 | Poor 47.9% |
Demographics Similar to Colombians by Disability Age Over 75
In terms of disability age over 75, the demographic groups most similar to Colombians are European (46.7%, a difference of 0.010%), Syrian (46.7%, a difference of 0.020%), Immigrants from South America (46.7%, a difference of 0.030%), Icelander (46.7%, a difference of 0.030%), and Immigrants from Germany (46.7%, a difference of 0.040%).
| Demographics | Rating | Rank | Disability Age Over 75 |
| Czechoslovakians | 94.7 /100 | #118 | Exceptional 46.6% |
| Canadians | 94.4 /100 | #119 | Exceptional 46.6% |
| Immigrants | Nepal | 94.1 /100 | #120 | Exceptional 46.6% |
| Scandinavians | 93.6 /100 | #121 | Exceptional 46.6% |
| Immigrants | Albania | 93.2 /100 | #122 | Exceptional 46.6% |
| Immigrants | Colombia | 92.6 /100 | #123 | Exceptional 46.7% |
| Immigrants | South America | 91.8 /100 | #124 | Exceptional 46.7% |
| Colombians | 91.3 /100 | #125 | Exceptional 46.7% |
| Europeans | 91.2 /100 | #126 | Exceptional 46.7% |
| Syrians | 91.1 /100 | #127 | Exceptional 46.7% |
| Icelanders | 90.9 /100 | #128 | Exceptional 46.7% |
| Immigrants | Germany | 90.8 /100 | #129 | Exceptional 46.7% |
| Immigrants | Northern Africa | 90.7 /100 | #130 | Exceptional 46.7% |
| Scottish | 90.5 /100 | #131 | Exceptional 46.7% |
| South Americans | 90.0 /100 | #132 | Excellent 46.8% |