Nicaraguan vs European Disability Age 65 to 74
COMPARE
Nicaraguan
European
Disability Age 65 to 74
Disability Age 65 to 74 Comparison
Nicaraguans
Europeans
23.9%
DISABILITY AGE 65 TO 74
14.3/ 100
METRIC RATING
213th/ 347
METRIC RANK
23.2%
DISABILITY AGE 65 TO 74
61.2/ 100
METRIC RATING
162nd/ 347
METRIC RANK
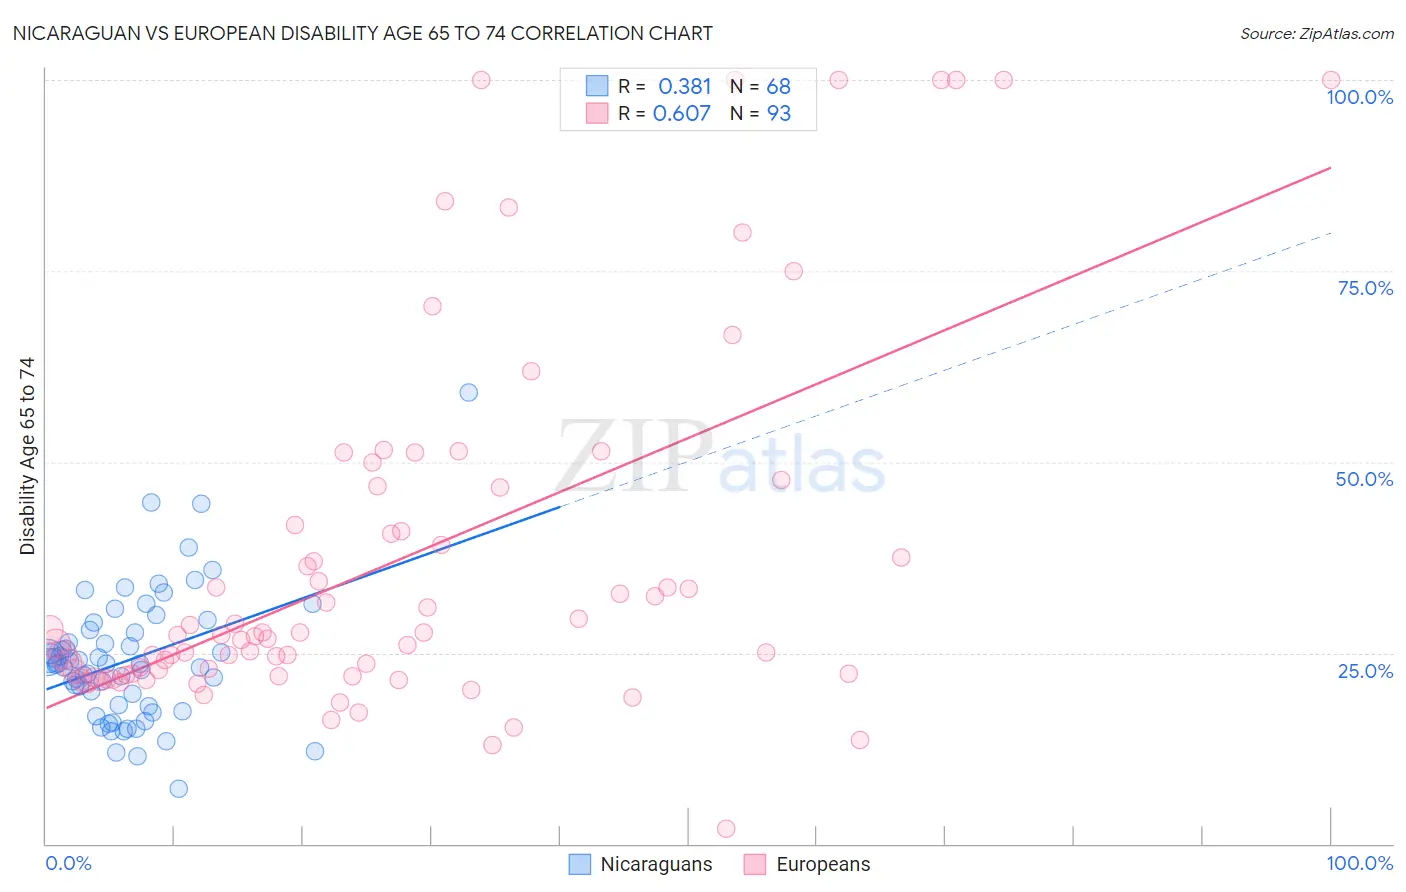
Nicaraguan vs European Disability Age 65 to 74 Correlation Chart
The statistical analysis conducted on geographies consisting of 285,318,687 people shows a mild positive correlation between the proportion of Nicaraguans and percentage of population with a disability between the ages 65 and 75 in the United States with a correlation coefficient (R) of 0.381 and weighted average of 23.9%. Similarly, the statistical analysis conducted on geographies consisting of 559,638,797 people shows a significant positive correlation between the proportion of Europeans and percentage of population with a disability between the ages 65 and 75 in the United States with a correlation coefficient (R) of 0.607 and weighted average of 23.2%, a difference of 3.3%.
Disability Age 65 to 74 Correlation Summary
| Measurement | Nicaraguan | European |
| Minimum | 7.2% | 2.0% |
| Maximum | 59.1% | 100.0% |
| Range | 52.0% | 98.0% |
| Mean | 24.1% | 37.1% |
| Median | 23.5% | 27.4% |
| Interquartile 25% (IQ1) | 18.0% | 22.2% |
| Interquartile 75% (IQ3) | 27.8% | 44.2% |
| Interquartile Range (IQR) | 9.8% | 22.0% |
| Standard Deviation (Sample) | 8.6% | 23.8% |
| Standard Deviation (Population) | 8.5% | 23.7% |
Similar Demographics by Disability Age 65 to 74
Demographics Similar to Nicaraguans by Disability Age 65 to 74
In terms of disability age 65 to 74, the demographic groups most similar to Nicaraguans are Immigrants from Oceania (24.0%, a difference of 0.080%), Pennsylvania German (24.0%, a difference of 0.12%), French (23.9%, a difference of 0.16%), Immigrants from West Indies (23.9%, a difference of 0.19%), and Trinidadian and Tobagonian (23.9%, a difference of 0.23%).
| Demographics | Rating | Rank | Disability Age 65 to 74 |
| Immigrants | Jamaica | 20.7 /100 | #206 | Fair 23.8% |
| Immigrants | Sudan | 20.1 /100 | #207 | Fair 23.8% |
| Immigrants | Barbados | 19.6 /100 | #208 | Poor 23.8% |
| Immigrants | Kenya | 19.6 /100 | #209 | Poor 23.8% |
| Trinidadians and Tobagonians | 16.4 /100 | #210 | Poor 23.9% |
| Immigrants | West Indies | 15.9 /100 | #211 | Poor 23.9% |
| French | 15.7 /100 | #212 | Poor 23.9% |
| Nicaraguans | 14.3 /100 | #213 | Poor 23.9% |
| Immigrants | Oceania | 13.6 /100 | #214 | Poor 24.0% |
| Pennsylvania Germans | 13.3 /100 | #215 | Poor 24.0% |
| Jamaicans | 12.2 /100 | #216 | Poor 24.0% |
| Immigrants | Portugal | 11.7 /100 | #217 | Poor 24.0% |
| Immigrants | Nigeria | 11.7 /100 | #218 | Poor 24.0% |
| Immigrants | Burma/Myanmar | 11.6 /100 | #219 | Poor 24.0% |
| Ghanaians | 10.4 /100 | #220 | Poor 24.1% |
Demographics Similar to Europeans by Disability Age 65 to 74
In terms of disability age 65 to 74, the demographic groups most similar to Europeans are Immigrants from Philippines (23.2%, a difference of 0.0%), Sierra Leonean (23.2%, a difference of 0.020%), Vietnamese (23.2%, a difference of 0.030%), Immigrants from Afghanistan (23.2%, a difference of 0.040%), and Immigrants from Cameroon (23.1%, a difference of 0.16%).
| Demographics | Rating | Rank | Disability Age 65 to 74 |
| British | 73.9 /100 | #155 | Good 23.0% |
| Immigrants | Western Asia | 73.8 /100 | #156 | Good 23.0% |
| Czechoslovakians | 72.4 /100 | #157 | Good 23.0% |
| Immigrants | Vietnam | 69.1 /100 | #158 | Good 23.1% |
| South American Indians | 65.5 /100 | #159 | Good 23.1% |
| Koreans | 64.2 /100 | #160 | Good 23.1% |
| Immigrants | Cameroon | 63.8 /100 | #161 | Good 23.1% |
| Europeans | 61.2 /100 | #162 | Good 23.2% |
| Immigrants | Philippines | 61.1 /100 | #163 | Good 23.2% |
| Sierra Leoneans | 60.9 /100 | #164 | Good 23.2% |
| Vietnamese | 60.8 /100 | #165 | Good 23.2% |
| Immigrants | Afghanistan | 60.5 /100 | #166 | Good 23.2% |
| Immigrants | Bosnia and Herzegovina | 57.6 /100 | #167 | Average 23.2% |
| Pakistanis | 57.0 /100 | #168 | Average 23.2% |
| Icelanders | 54.3 /100 | #169 | Average 23.3% |