Nepalese vs Immigrants from Argentina Cognitive Disability
COMPARE
Nepalese
Immigrants from Argentina
Cognitive Disability
Cognitive Disability Comparison
Nepalese
Immigrants from Argentina
18.0%
COGNITIVE DISABILITY
0.3/ 100
METRIC RATING
267th/ 347
METRIC RANK
16.4%
COGNITIVE DISABILITY
99.9/ 100
METRIC RATING
24th/ 347
METRIC RANK
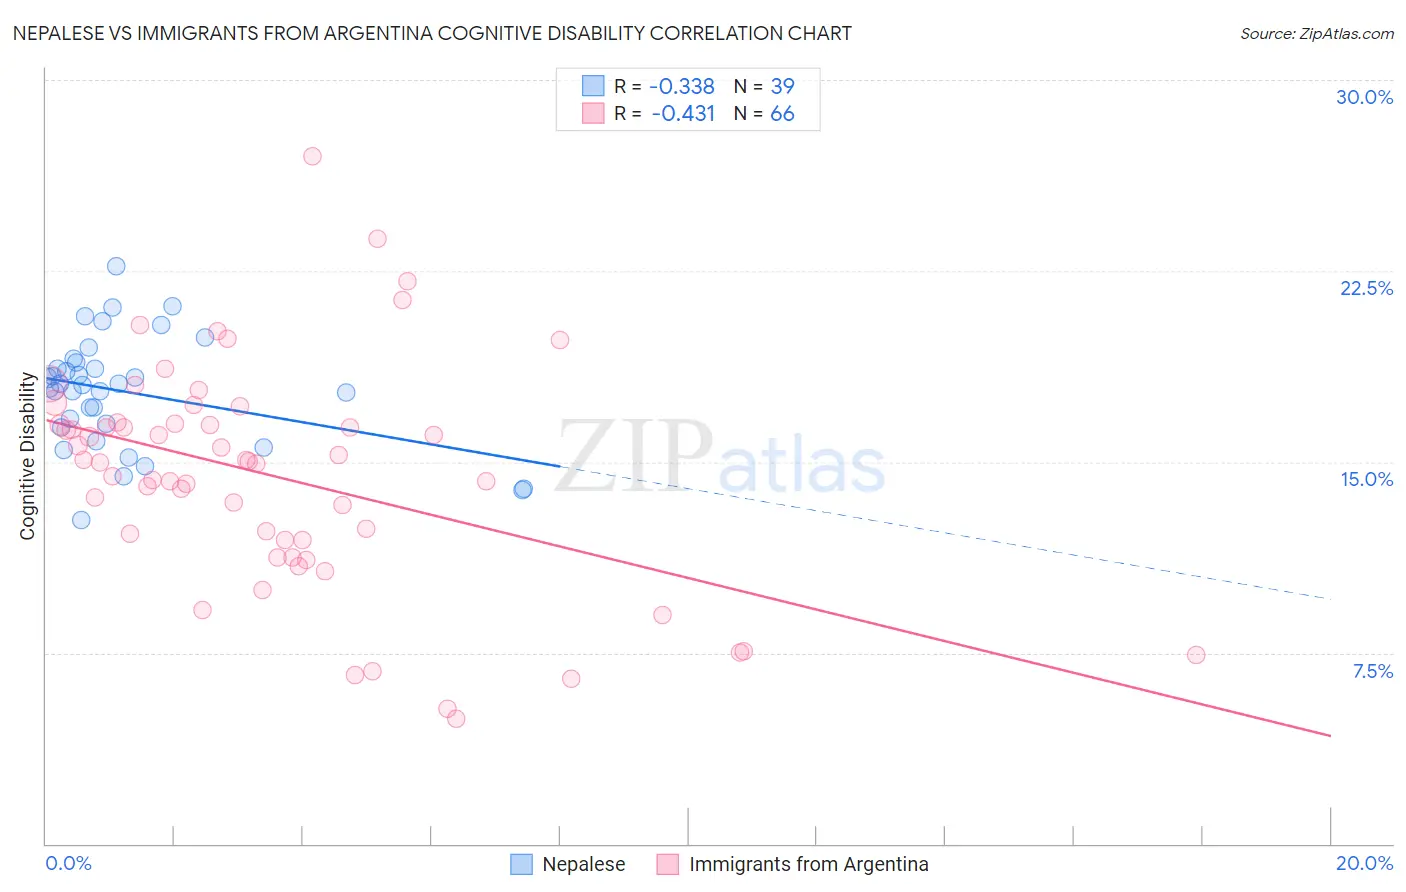
Nepalese vs Immigrants from Argentina Cognitive Disability Correlation Chart
The statistical analysis conducted on geographies consisting of 24,519,269 people shows a mild negative correlation between the proportion of Nepalese and percentage of population with cognitive disability in the United States with a correlation coefficient (R) of -0.338 and weighted average of 18.0%. Similarly, the statistical analysis conducted on geographies consisting of 264,433,945 people shows a moderate negative correlation between the proportion of Immigrants from Argentina and percentage of population with cognitive disability in the United States with a correlation coefficient (R) of -0.431 and weighted average of 16.4%, a difference of 9.8%.
Cognitive Disability Correlation Summary
| Measurement | Nepalese | Immigrants from Argentina |
| Minimum | 12.7% | 4.9% |
| Maximum | 22.7% | 27.0% |
| Range | 10.0% | 22.1% |
| Mean | 17.7% | 14.4% |
| Median | 18.0% | 15.0% |
| Interquartile 25% (IQ1) | 16.4% | 11.9% |
| Interquartile 75% (IQ3) | 18.9% | 16.5% |
| Interquartile Range (IQR) | 2.6% | 4.6% |
| Standard Deviation (Sample) | 2.2% | 4.4% |
| Standard Deviation (Population) | 2.2% | 4.4% |
Similar Demographics by Cognitive Disability
Demographics Similar to Nepalese by Cognitive Disability
In terms of cognitive disability, the demographic groups most similar to Nepalese are Cherokee (18.0%, a difference of 0.010%), Spanish American (18.0%, a difference of 0.060%), Belizean (18.0%, a difference of 0.060%), Menominee (18.0%, a difference of 0.090%), and Immigrants from Barbados (17.9%, a difference of 0.15%).
| Demographics | Rating | Rank | Cognitive Disability |
| Immigrants | Belize | 0.5 /100 | #260 | Tragic 17.9% |
| Guamanians/Chamorros | 0.5 /100 | #261 | Tragic 17.9% |
| Sierra Leoneans | 0.4 /100 | #262 | Tragic 17.9% |
| Immigrants | Barbados | 0.4 /100 | #263 | Tragic 17.9% |
| Menominee | 0.4 /100 | #264 | Tragic 18.0% |
| Spanish Americans | 0.4 /100 | #265 | Tragic 18.0% |
| Belizeans | 0.4 /100 | #266 | Tragic 18.0% |
| Nepalese | 0.3 /100 | #267 | Tragic 18.0% |
| Cherokee | 0.3 /100 | #268 | Tragic 18.0% |
| Hondurans | 0.3 /100 | #269 | Tragic 18.0% |
| Immigrants | Bahamas | 0.3 /100 | #270 | Tragic 18.0% |
| Potawatomi | 0.2 /100 | #271 | Tragic 18.0% |
| Immigrants | Honduras | 0.2 /100 | #272 | Tragic 18.0% |
| Immigrants | Nepal | 0.2 /100 | #273 | Tragic 18.0% |
| Immigrants | Nigeria | 0.2 /100 | #274 | Tragic 18.0% |
Demographics Similar to Immigrants from Argentina by Cognitive Disability
In terms of cognitive disability, the demographic groups most similar to Immigrants from Argentina are Croatian (16.4%, a difference of 0.030%), Luxembourger (16.4%, a difference of 0.040%), Immigrants from South Central Asia (16.4%, a difference of 0.060%), Immigrants from Croatia (16.4%, a difference of 0.070%), and Immigrants from Pakistan (16.4%, a difference of 0.090%).
| Demographics | Rating | Rank | Cognitive Disability |
| Immigrants | North Macedonia | 100.0 /100 | #17 | Exceptional 16.3% |
| Immigrants | Northern Europe | 100.0 /100 | #18 | Exceptional 16.3% |
| Immigrants | Bolivia | 100.0 /100 | #19 | Exceptional 16.3% |
| Bulgarians | 100.0 /100 | #20 | Exceptional 16.3% |
| Immigrants | Cuba | 100.0 /100 | #21 | Exceptional 16.3% |
| Immigrants | South Central Asia | 99.9 /100 | #22 | Exceptional 16.4% |
| Croatians | 99.9 /100 | #23 | Exceptional 16.4% |
| Immigrants | Argentina | 99.9 /100 | #24 | Exceptional 16.4% |
| Luxembourgers | 99.9 /100 | #25 | Exceptional 16.4% |
| Immigrants | Croatia | 99.9 /100 | #26 | Exceptional 16.4% |
| Immigrants | Pakistan | 99.9 /100 | #27 | Exceptional 16.4% |
| Poles | 99.9 /100 | #28 | Exceptional 16.4% |
| Filipinos | 99.9 /100 | #29 | Exceptional 16.4% |
| Czechs | 99.9 /100 | #30 | Exceptional 16.4% |
| Immigrants | Romania | 99.9 /100 | #31 | Exceptional 16.4% |