Nepalese vs British West Indian Disability Age 35 to 64
COMPARE
Nepalese
British West Indian
Disability Age 35 to 64
Disability Age 35 to 64 Comparison
Nepalese
British West Indians
12.8%
DISABILITY AGE 35 TO 64
0.1/ 100
METRIC RATING
271st/ 347
METRIC RANK
11.9%
DISABILITY AGE 35 TO 64
6.1/ 100
METRIC RATING
229th/ 347
METRIC RANK
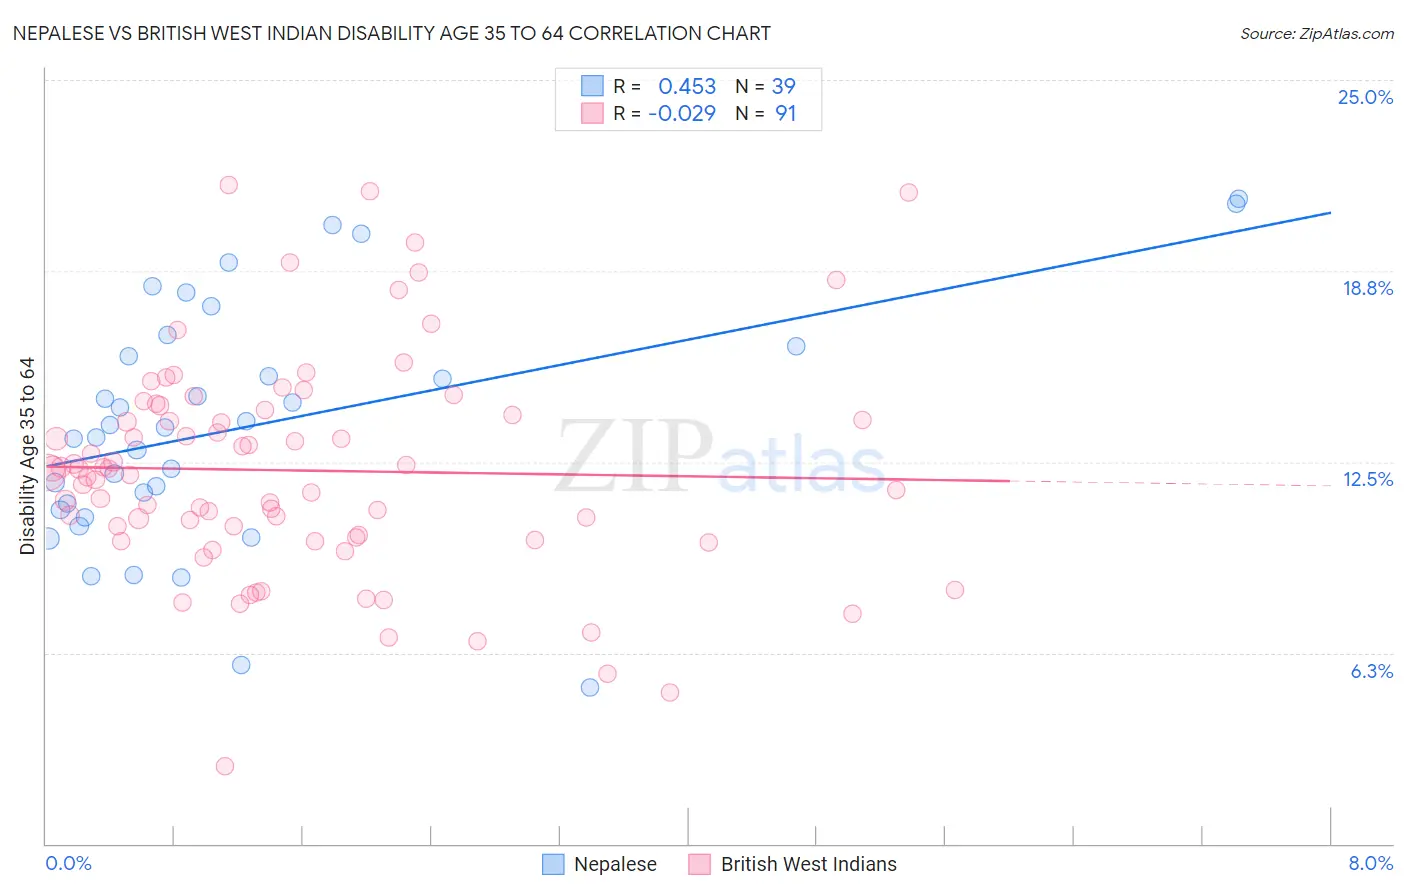
Nepalese vs British West Indian Disability Age 35 to 64 Correlation Chart
The statistical analysis conducted on geographies consisting of 24,500,920 people shows a moderate positive correlation between the proportion of Nepalese and percentage of population with a disability between the ages 34 and 64 in the United States with a correlation coefficient (R) of 0.453 and weighted average of 12.8%. Similarly, the statistical analysis conducted on geographies consisting of 152,636,583 people shows no correlation between the proportion of British West Indians and percentage of population with a disability between the ages 34 and 64 in the United States with a correlation coefficient (R) of -0.029 and weighted average of 11.9%, a difference of 7.8%.
Disability Age 35 to 64 Correlation Summary
| Measurement | Nepalese | British West Indian |
| Minimum | 5.1% | 2.5% |
| Maximum | 21.1% | 21.5% |
| Range | 16.0% | 19.0% |
| Mean | 13.7% | 12.2% |
| Median | 13.6% | 12.1% |
| Interquartile 25% (IQ1) | 10.9% | 10.0% |
| Interquartile 75% (IQ3) | 16.3% | 14.2% |
| Interquartile Range (IQR) | 5.3% | 4.2% |
| Standard Deviation (Sample) | 3.9% | 3.6% |
| Standard Deviation (Population) | 3.9% | 3.6% |
Similar Demographics by Disability Age 35 to 64
Demographics Similar to Nepalese by Disability Age 35 to 64
In terms of disability age 35 to 64, the demographic groups most similar to Nepalese are U.S. Virgin Islander (12.8%, a difference of 0.12%), Pennsylvania German (12.8%, a difference of 0.21%), Celtic (12.9%, a difference of 0.23%), Dominican (12.9%, a difference of 0.37%), and Somali (12.9%, a difference of 0.49%).
| Demographics | Rating | Rank | Disability Age 35 to 64 |
| Immigrants | Portugal | 0.4 /100 | #264 | Tragic 12.5% |
| Marshallese | 0.4 /100 | #265 | Tragic 12.5% |
| Whites/Caucasians | 0.3 /100 | #266 | Tragic 12.6% |
| Sub-Saharan Africans | 0.2 /100 | #267 | Tragic 12.6% |
| Immigrants | Dominica | 0.2 /100 | #268 | Tragic 12.7% |
| Spanish | 0.2 /100 | #269 | Tragic 12.7% |
| French | 0.2 /100 | #270 | Tragic 12.7% |
| Nepalese | 0.1 /100 | #271 | Tragic 12.8% |
| U.S. Virgin Islanders | 0.1 /100 | #272 | Tragic 12.8% |
| Pennsylvania Germans | 0.1 /100 | #273 | Tragic 12.8% |
| Celtics | 0.1 /100 | #274 | Tragic 12.9% |
| Dominicans | 0.1 /100 | #275 | Tragic 12.9% |
| Somalis | 0.1 /100 | #276 | Tragic 12.9% |
| Immigrants | Dominican Republic | 0.1 /100 | #277 | Tragic 12.9% |
| French Canadians | 0.1 /100 | #278 | Tragic 12.9% |
Demographics Similar to British West Indians by Disability Age 35 to 64
In terms of disability age 35 to 64, the demographic groups most similar to British West Indians are Immigrants from Germany (11.9%, a difference of 0.020%), Immigrants from Central America (11.9%, a difference of 0.060%), Scandinavian (11.9%, a difference of 0.090%), Panamanian (11.9%, a difference of 0.10%), and Jamaican (11.9%, a difference of 0.13%).
| Demographics | Rating | Rank | Disability Age 35 to 64 |
| Hondurans | 8.4 /100 | #222 | Tragic 11.8% |
| Immigrants | Honduras | 8.4 /100 | #223 | Tragic 11.8% |
| Immigrants | Ghana | 7.8 /100 | #224 | Tragic 11.8% |
| Immigrants | Belize | 6.6 /100 | #225 | Tragic 11.9% |
| Scandinavians | 6.4 /100 | #226 | Tragic 11.9% |
| Immigrants | Central America | 6.3 /100 | #227 | Tragic 11.9% |
| Immigrants | Germany | 6.2 /100 | #228 | Tragic 11.9% |
| British West Indians | 6.1 /100 | #229 | Tragic 11.9% |
| Panamanians | 5.8 /100 | #230 | Tragic 11.9% |
| Jamaicans | 5.7 /100 | #231 | Tragic 11.9% |
| Sudanese | 5.3 /100 | #232 | Tragic 11.9% |
| Bermudans | 5.0 /100 | #233 | Tragic 11.9% |
| Portuguese | 4.9 /100 | #234 | Tragic 11.9% |
| Belizeans | 4.5 /100 | #235 | Tragic 12.0% |
| Immigrants | Middle Africa | 4.5 /100 | #236 | Tragic 12.0% |