Navajo vs Yup'ik Disability Age 35 to 64
COMPARE
Navajo
Yup'ik
Disability Age 35 to 64
Disability Age 35 to 64 Comparison
Navajo
Yup'ik
15.5%
DISABILITY AGE 35 TO 64
0.0/ 100
METRIC RATING
330th/ 347
METRIC RANK
16.9%
DISABILITY AGE 35 TO 64
0.0/ 100
METRIC RATING
344th/ 347
METRIC RANK
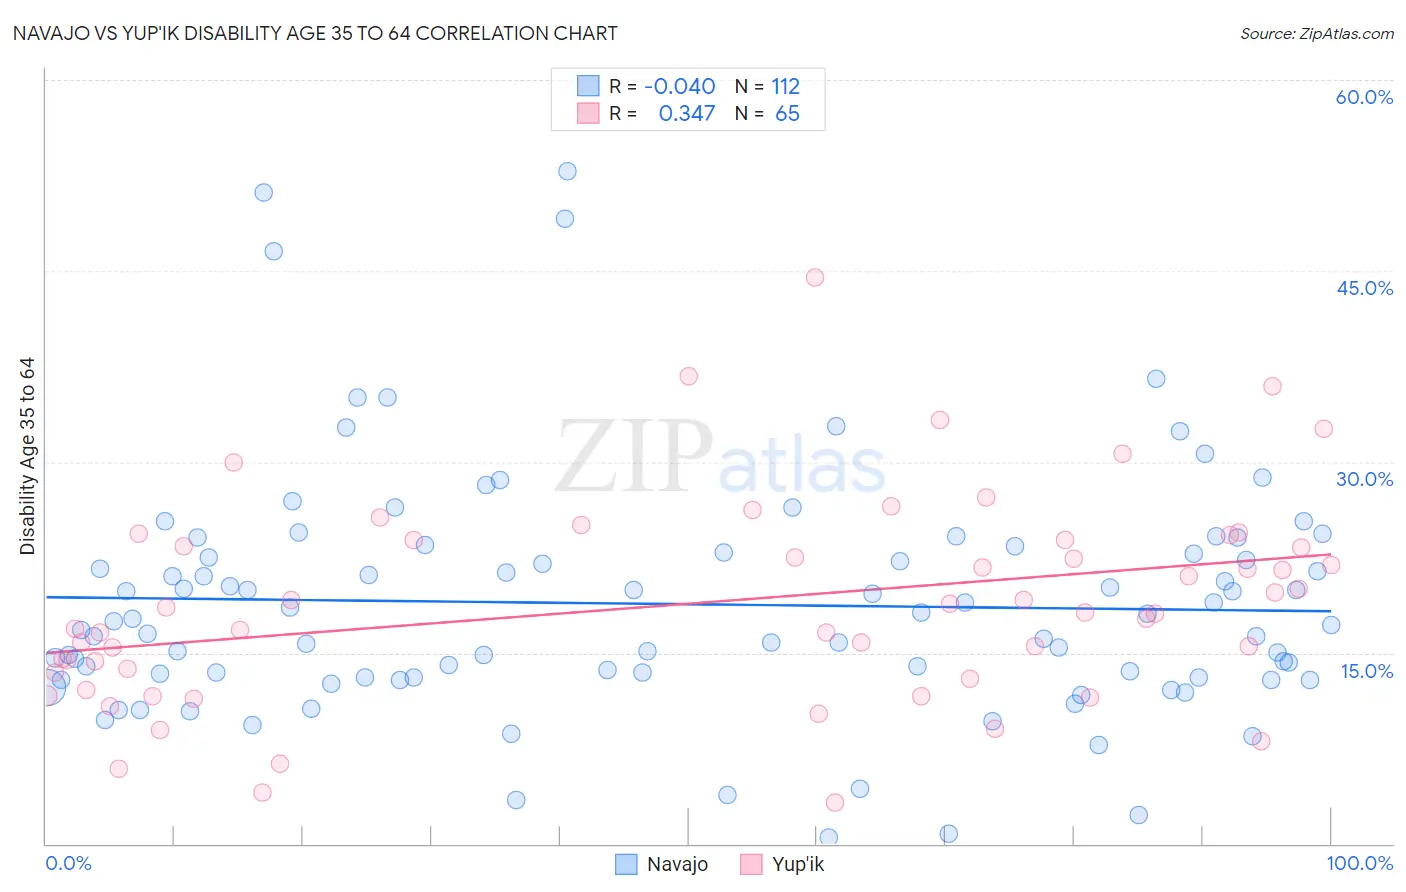
Navajo vs Yup'ik Disability Age 35 to 64 Correlation Chart
The statistical analysis conducted on geographies consisting of 224,738,454 people shows no correlation between the proportion of Navajo and percentage of population with a disability between the ages 34 and 64 in the United States with a correlation coefficient (R) of -0.040 and weighted average of 15.5%. Similarly, the statistical analysis conducted on geographies consisting of 39,958,174 people shows a mild positive correlation between the proportion of Yup'ik and percentage of population with a disability between the ages 34 and 64 in the United States with a correlation coefficient (R) of 0.347 and weighted average of 16.9%, a difference of 9.4%.
Disability Age 35 to 64 Correlation Summary
| Measurement | Navajo | Yup'ik |
| Minimum | 0.53% | 3.2% |
| Maximum | 52.8% | 44.4% |
| Range | 52.3% | 41.2% |
| Mean | 18.8% | 18.9% |
| Median | 17.3% | 18.2% |
| Interquartile 25% (IQ1) | 13.1% | 13.2% |
| Interquartile 75% (IQ3) | 22.8% | 23.9% |
| Interquartile Range (IQR) | 9.7% | 10.6% |
| Standard Deviation (Sample) | 9.4% | 8.1% |
| Standard Deviation (Population) | 9.3% | 8.1% |
Demographics Similar to Navajo and Yup'ik by Disability Age 35 to 64
In terms of disability age 35 to 64, the demographic groups most similar to Navajo are Cherokee (15.5%, a difference of 0.20%), Dutch West Indian (15.6%, a difference of 0.92%), Cajun (15.3%, a difference of 0.96%), Pueblo (15.3%, a difference of 1.1%), and Alaskan Athabascan (15.7%, a difference of 1.5%). Similarly, the demographic groups most similar to Yup'ik are Creek (16.9%, a difference of 0.32%), Tohono O'odham (16.7%, a difference of 1.2%), Tsimshian (16.7%, a difference of 1.3%), Kiowa (17.4%, a difference of 2.5%), and Choctaw (16.4%, a difference of 3.2%).
| Demographics | Rating | Rank | Disability Age 35 to 64 |
| Pueblo | 0.0 /100 | #327 | Tragic 15.3% |
| Cajuns | 0.0 /100 | #328 | Tragic 15.3% |
| Cherokee | 0.0 /100 | #329 | Tragic 15.5% |
| Navajo | 0.0 /100 | #330 | Tragic 15.5% |
| Dutch West Indians | 0.0 /100 | #331 | Tragic 15.6% |
| Alaskan Athabascans | 0.0 /100 | #332 | Tragic 15.7% |
| Yuman | 0.0 /100 | #333 | Tragic 15.8% |
| Colville | 0.0 /100 | #334 | Tragic 15.8% |
| Seminole | 0.0 /100 | #335 | Tragic 15.9% |
| Menominee | 0.0 /100 | #336 | Tragic 15.9% |
| Puerto Ricans | 0.0 /100 | #337 | Tragic 15.9% |
| Chickasaw | 0.0 /100 | #338 | Tragic 16.1% |
| Pima | 0.0 /100 | #339 | Tragic 16.1% |
| Choctaw | 0.0 /100 | #340 | Tragic 16.4% |
| Tsimshian | 0.0 /100 | #341 | Tragic 16.7% |
| Tohono O'odham | 0.0 /100 | #342 | Tragic 16.7% |
| Creek | 0.0 /100 | #343 | Tragic 16.9% |
| Yup'ik | 0.0 /100 | #344 | Tragic 16.9% |
| Kiowa | 0.0 /100 | #345 | Tragic 17.4% |
| Lumbee | 0.0 /100 | #346 | Tragic 17.6% |
| Houma | 0.0 /100 | #347 | Tragic 18.7% |