Native/Alaskan vs Potawatomi Disability Age 65 to 74
COMPARE
Native/Alaskan
Potawatomi
Disability Age 65 to 74
Disability Age 65 to 74 Comparison
Natives/Alaskans
Potawatomi
30.4%
DISABILITY AGE 65 TO 74
0.0/ 100
METRIC RATING
332nd/ 347
METRIC RANK
27.0%
DISABILITY AGE 65 TO 74
0.0/ 100
METRIC RATING
299th/ 347
METRIC RANK
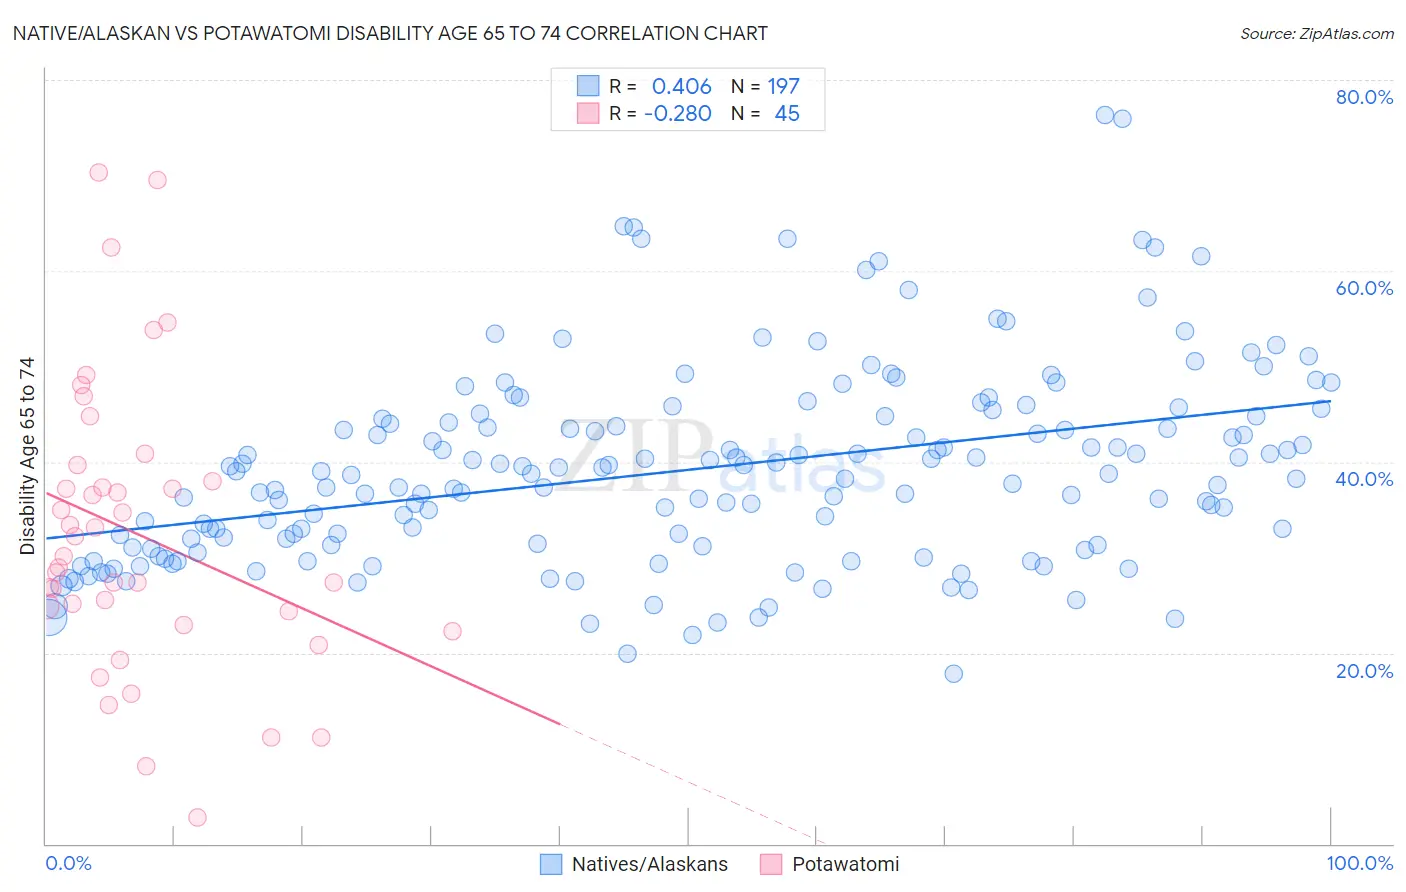
Native/Alaskan vs Potawatomi Disability Age 65 to 74 Correlation Chart
The statistical analysis conducted on geographies consisting of 511,555,776 people shows a moderate positive correlation between the proportion of Natives/Alaskans and percentage of population with a disability between the ages 65 and 75 in the United States with a correlation coefficient (R) of 0.406 and weighted average of 30.4%. Similarly, the statistical analysis conducted on geographies consisting of 117,710,706 people shows a weak negative correlation between the proportion of Potawatomi and percentage of population with a disability between the ages 65 and 75 in the United States with a correlation coefficient (R) of -0.280 and weighted average of 27.0%, a difference of 12.5%.
Disability Age 65 to 74 Correlation Summary
| Measurement | Native/Alaskan | Potawatomi |
| Minimum | 17.9% | 2.7% |
| Maximum | 76.4% | 70.4% |
| Range | 58.5% | 67.7% |
| Mean | 39.2% | 32.5% |
| Median | 38.6% | 30.1% |
| Interquartile 25% (IQ1) | 31.2% | 23.6% |
| Interquartile 75% (IQ3) | 44.7% | 38.9% |
| Interquartile Range (IQR) | 13.4% | 15.2% |
| Standard Deviation (Sample) | 10.3% | 15.0% |
| Standard Deviation (Population) | 10.3% | 14.9% |
Similar Demographics by Disability Age 65 to 74
Demographics Similar to Natives/Alaskans by Disability Age 65 to 74
In terms of disability age 65 to 74, the demographic groups most similar to Natives/Alaskans are Colville (30.5%, a difference of 0.52%), Chickasaw (30.2%, a difference of 0.62%), Creek (30.2%, a difference of 0.63%), Choctaw (30.2%, a difference of 0.66%), and Alaska Native (30.6%, a difference of 0.77%).
| Demographics | Rating | Rank | Disability Age 65 to 74 |
| Dutch West Indians | 0.0 /100 | #325 | Tragic 29.6% |
| Yakama | 0.0 /100 | #326 | Tragic 29.6% |
| Apache | 0.0 /100 | #327 | Tragic 29.7% |
| Hopi | 0.0 /100 | #328 | Tragic 30.0% |
| Choctaw | 0.0 /100 | #329 | Tragic 30.2% |
| Creek | 0.0 /100 | #330 | Tragic 30.2% |
| Chickasaw | 0.0 /100 | #331 | Tragic 30.2% |
| Natives/Alaskans | 0.0 /100 | #332 | Tragic 30.4% |
| Colville | 0.0 /100 | #333 | Tragic 30.5% |
| Alaska Natives | 0.0 /100 | #334 | Tragic 30.6% |
| Cheyenne | 0.0 /100 | #335 | Tragic 31.1% |
| Yuman | 0.0 /100 | #336 | Tragic 31.5% |
| Houma | 0.0 /100 | #337 | Tragic 32.3% |
| Alaskan Athabascans | 0.0 /100 | #338 | Tragic 32.4% |
| Kiowa | 0.0 /100 | #339 | Tragic 32.6% |
Demographics Similar to Potawatomi by Disability Age 65 to 74
In terms of disability age 65 to 74, the demographic groups most similar to Potawatomi are Immigrants from Yemen (27.0%, a difference of 0.030%), Immigrants from Dominican Republic (27.0%, a difference of 0.030%), Fijian (27.0%, a difference of 0.050%), Immigrants from Mexico (27.1%, a difference of 0.35%), and Central American Indian (27.1%, a difference of 0.36%).
| Demographics | Rating | Rank | Disability Age 65 to 74 |
| Blackfeet | 0.0 /100 | #292 | Tragic 26.6% |
| Immigrants | Central America | 0.0 /100 | #293 | Tragic 26.6% |
| Dominicans | 0.0 /100 | #294 | Tragic 26.7% |
| Hispanics or Latinos | 0.0 /100 | #295 | Tragic 26.7% |
| Bangladeshis | 0.0 /100 | #296 | Tragic 26.8% |
| Fijians | 0.0 /100 | #297 | Tragic 27.0% |
| Immigrants | Yemen | 0.0 /100 | #298 | Tragic 27.0% |
| Potawatomi | 0.0 /100 | #299 | Tragic 27.0% |
| Immigrants | Dominican Republic | 0.0 /100 | #300 | Tragic 27.0% |
| Immigrants | Mexico | 0.0 /100 | #301 | Tragic 27.1% |
| Central American Indians | 0.0 /100 | #302 | Tragic 27.1% |
| Tlingit-Haida | 0.0 /100 | #303 | Tragic 27.1% |
| Puget Sound Salish | 0.0 /100 | #304 | Tragic 27.2% |
| Mexicans | 0.0 /100 | #305 | Tragic 27.2% |
| Blacks/African Americans | 0.0 /100 | #306 | Tragic 27.3% |