Native Hawaiian vs Immigrants from Latvia Disability Age 65 to 74
COMPARE
Native Hawaiian
Immigrants from Latvia
Disability Age 65 to 74
Disability Age 65 to 74 Comparison
Native Hawaiians
Immigrants from Latvia
24.1%
DISABILITY AGE 65 TO 74
9.3/ 100
METRIC RATING
222nd/ 347
METRIC RANK
21.6%
DISABILITY AGE 65 TO 74
99.4/ 100
METRIC RATING
64th/ 347
METRIC RANK
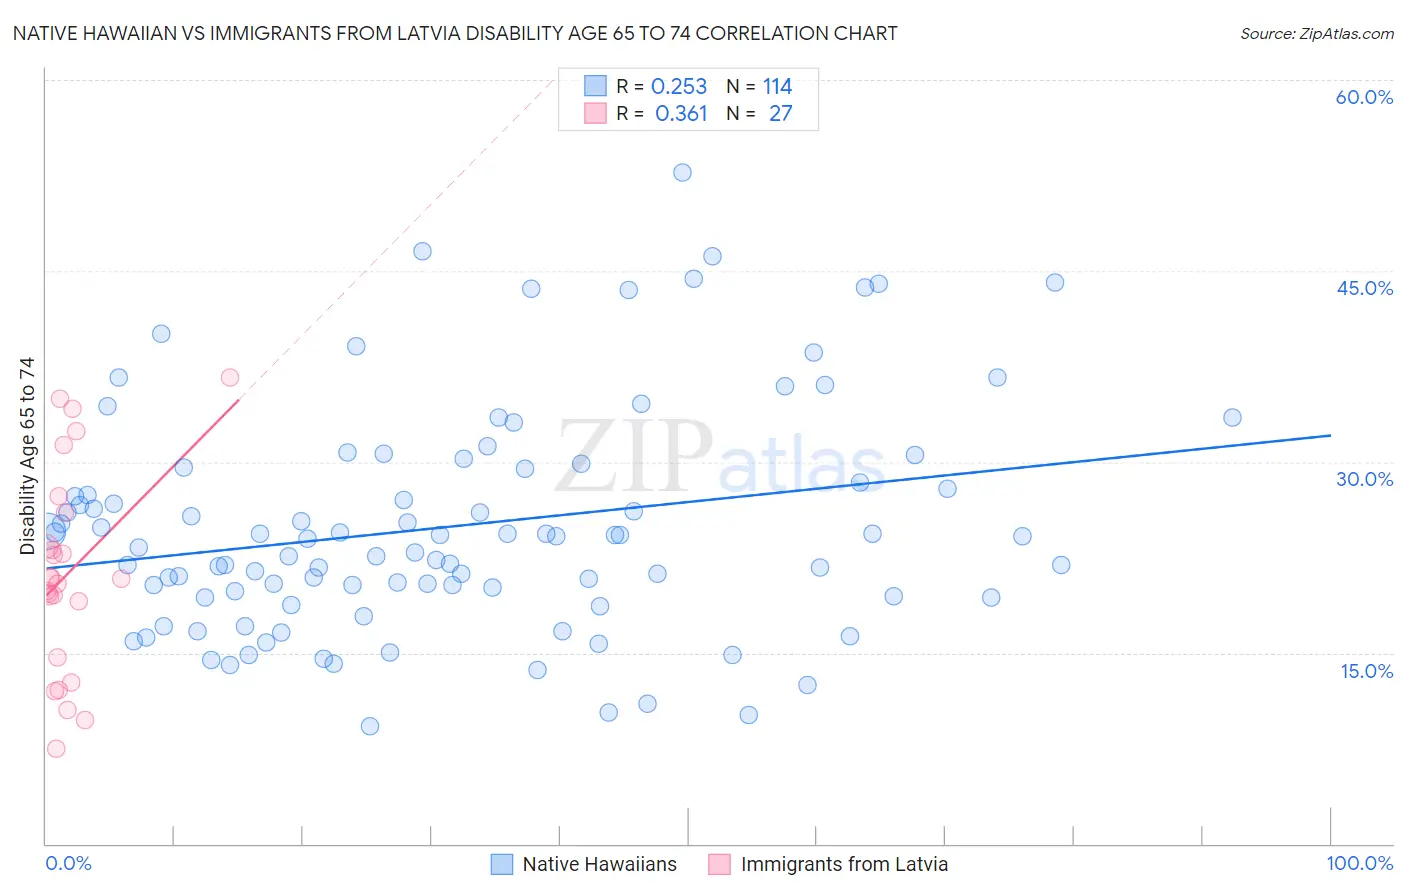
Native Hawaiian vs Immigrants from Latvia Disability Age 65 to 74 Correlation Chart
The statistical analysis conducted on geographies consisting of 331,315,528 people shows a weak positive correlation between the proportion of Native Hawaiians and percentage of population with a disability between the ages 65 and 75 in the United States with a correlation coefficient (R) of 0.253 and weighted average of 24.1%. Similarly, the statistical analysis conducted on geographies consisting of 113,682,371 people shows a mild positive correlation between the proportion of Immigrants from Latvia and percentage of population with a disability between the ages 65 and 75 in the United States with a correlation coefficient (R) of 0.361 and weighted average of 21.6%, a difference of 11.6%.
Disability Age 65 to 74 Correlation Summary
| Measurement | Native Hawaiian | Immigrants from Latvia |
| Minimum | 9.2% | 7.5% |
| Maximum | 52.7% | 36.7% |
| Range | 43.5% | 29.2% |
| Mean | 24.9% | 21.3% |
| Median | 24.1% | 20.8% |
| Interquartile 25% (IQ1) | 19.4% | 14.6% |
| Interquartile 75% (IQ3) | 29.5% | 26.0% |
| Interquartile Range (IQR) | 10.1% | 11.4% |
| Standard Deviation (Sample) | 8.9% | 7.9% |
| Standard Deviation (Population) | 8.8% | 7.8% |
Similar Demographics by Disability Age 65 to 74
Demographics Similar to Native Hawaiians by Disability Age 65 to 74
In terms of disability age 65 to 74, the demographic groups most similar to Native Hawaiians are Immigrants from Nicaragua (24.1%, a difference of 0.070%), Immigrants from Middle Africa (24.1%, a difference of 0.070%), Immigrants from Panama (24.1%, a difference of 0.12%), Ghanaian (24.1%, a difference of 0.16%), and Bermudan (24.2%, a difference of 0.20%).
| Demographics | Rating | Rank | Disability Age 65 to 74 |
| Pennsylvania Germans | 13.3 /100 | #215 | Poor 24.0% |
| Jamaicans | 12.2 /100 | #216 | Poor 24.0% |
| Immigrants | Portugal | 11.7 /100 | #217 | Poor 24.0% |
| Immigrants | Nigeria | 11.7 /100 | #218 | Poor 24.0% |
| Immigrants | Burma/Myanmar | 11.6 /100 | #219 | Poor 24.0% |
| Ghanaians | 10.4 /100 | #220 | Poor 24.1% |
| Immigrants | Nicaragua | 9.8 /100 | #221 | Tragic 24.1% |
| Native Hawaiians | 9.3 /100 | #222 | Tragic 24.1% |
| Immigrants | Middle Africa | 8.9 /100 | #223 | Tragic 24.1% |
| Immigrants | Panama | 8.6 /100 | #224 | Tragic 24.1% |
| Bermudans | 8.2 /100 | #225 | Tragic 24.2% |
| Iraqis | 8.1 /100 | #226 | Tragic 24.2% |
| Nigerians | 7.8 /100 | #227 | Tragic 24.2% |
| Whites/Caucasians | 6.6 /100 | #228 | Tragic 24.2% |
| Celtics | 6.4 /100 | #229 | Tragic 24.2% |
Demographics Similar to Immigrants from Latvia by Disability Age 65 to 74
In terms of disability age 65 to 74, the demographic groups most similar to Immigrants from Latvia are Immigrants from Russia (21.6%, a difference of 0.010%), Maltese (21.6%, a difference of 0.030%), Immigrants from Europe (21.6%, a difference of 0.080%), Carpatho Rusyn (21.6%, a difference of 0.18%), and Egyptian (21.6%, a difference of 0.20%).
| Demographics | Rating | Rank | Disability Age 65 to 74 |
| Immigrants | Asia | 99.5 /100 | #57 | Exceptional 21.5% |
| Immigrants | Pakistan | 99.5 /100 | #58 | Exceptional 21.5% |
| Zimbabweans | 99.5 /100 | #59 | Exceptional 21.5% |
| Immigrants | North Macedonia | 99.5 /100 | #60 | Exceptional 21.6% |
| Egyptians | 99.5 /100 | #61 | Exceptional 21.6% |
| Carpatho Rusyns | 99.5 /100 | #62 | Exceptional 21.6% |
| Immigrants | Europe | 99.4 /100 | #63 | Exceptional 21.6% |
| Immigrants | Latvia | 99.4 /100 | #64 | Exceptional 21.6% |
| Immigrants | Russia | 99.4 /100 | #65 | Exceptional 21.6% |
| Maltese | 99.4 /100 | #66 | Exceptional 21.6% |
| Immigrants | South Africa | 99.3 /100 | #67 | Exceptional 21.7% |
| Immigrants | Scotland | 99.3 /100 | #68 | Exceptional 21.7% |
| Immigrants | Egypt | 99.2 /100 | #69 | Exceptional 21.7% |
| Chinese | 99.2 /100 | #70 | Exceptional 21.7% |
| Immigrants | Belarus | 99.2 /100 | #71 | Exceptional 21.7% |