Marshallese vs Immigrants from Ethiopia Disability Age Over 75
COMPARE
Marshallese
Immigrants from Ethiopia
Disability Age Over 75
Disability Age Over 75 Comparison
Marshallese
Immigrants from Ethiopia
50.1%
DISABILITY AGE OVER 75
0.0/ 100
METRIC RATING
298th/ 347
METRIC RANK
46.8%
DISABILITY AGE OVER 75
89.1/ 100
METRIC RATING
134th/ 347
METRIC RANK
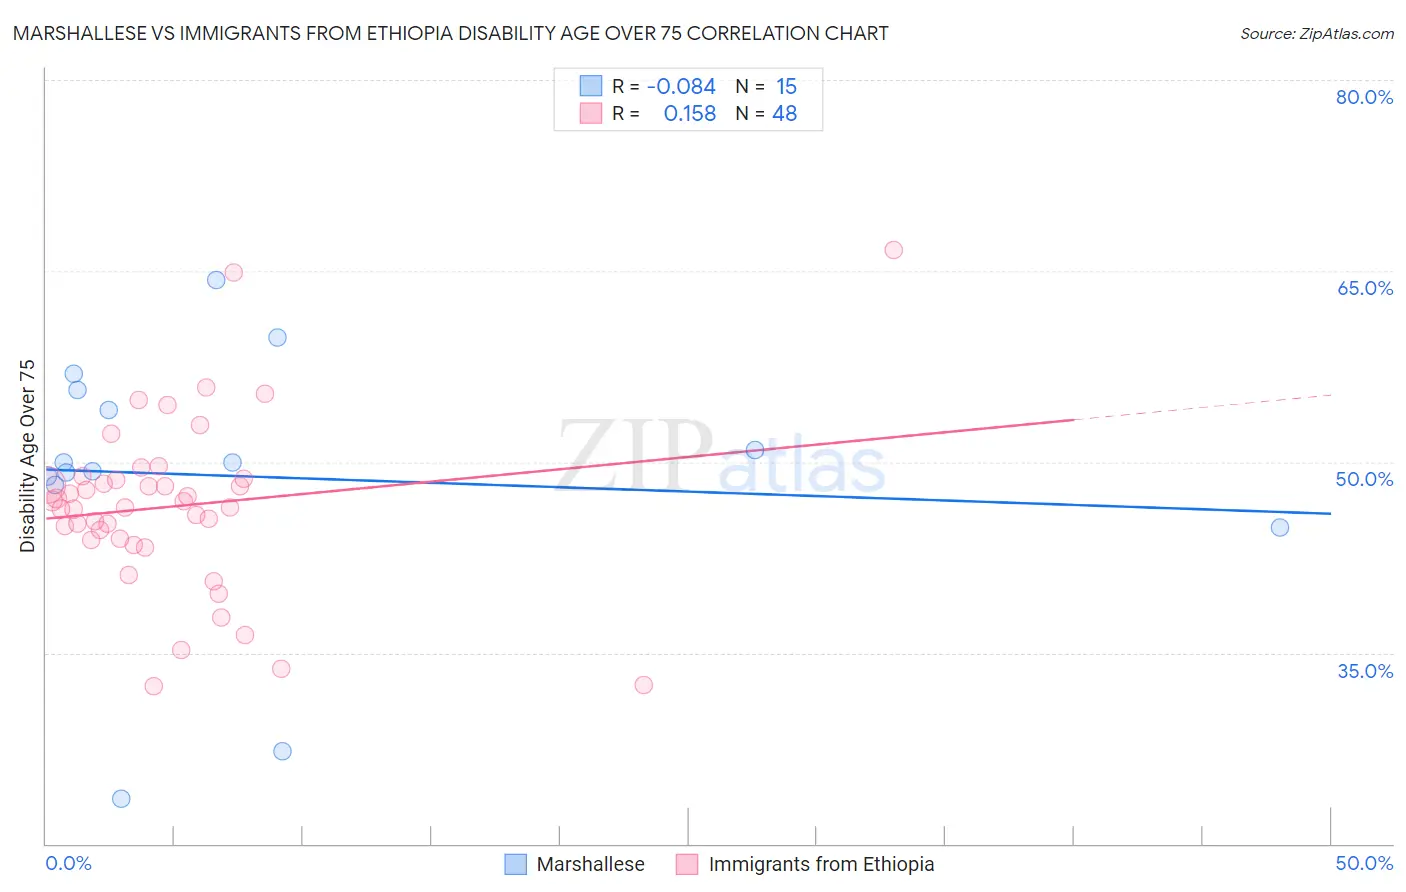
Marshallese vs Immigrants from Ethiopia Disability Age Over 75 Correlation Chart
The statistical analysis conducted on geographies consisting of 14,759,035 people shows a slight negative correlation between the proportion of Marshallese and percentage of population with a disability over the age of 75 in the United States with a correlation coefficient (R) of -0.084 and weighted average of 50.1%. Similarly, the statistical analysis conducted on geographies consisting of 211,333,041 people shows a poor positive correlation between the proportion of Immigrants from Ethiopia and percentage of population with a disability over the age of 75 in the United States with a correlation coefficient (R) of 0.158 and weighted average of 46.8%, a difference of 7.0%.
Disability Age Over 75 Correlation Summary
| Measurement | Marshallese | Immigrants from Ethiopia |
| Minimum | 23.5% | 32.4% |
| Maximum | 64.3% | 66.7% |
| Range | 40.8% | 34.3% |
| Mean | 48.9% | 46.5% |
| Median | 49.9% | 46.7% |
| Interquartile 25% (IQ1) | 48.2% | 43.9% |
| Interquartile 75% (IQ3) | 55.7% | 48.6% |
| Interquartile Range (IQR) | 7.5% | 4.7% |
| Standard Deviation (Sample) | 10.8% | 6.8% |
| Standard Deviation (Population) | 10.4% | 6.8% |
Similar Demographics by Disability Age Over 75
Demographics Similar to Marshallese by Disability Age Over 75
In terms of disability age over 75, the demographic groups most similar to Marshallese are Armenian (50.0%, a difference of 0.050%), Immigrants from Micronesia (50.1%, a difference of 0.070%), Mexican American Indian (50.0%, a difference of 0.080%), Cape Verdean (50.1%, a difference of 0.10%), and Spanish American (50.0%, a difference of 0.12%).
| Demographics | Rating | Rank | Disability Age Over 75 |
| Arapaho | 0.0 /100 | #291 | Tragic 49.8% |
| Shoshone | 0.0 /100 | #292 | Tragic 49.9% |
| Spanish American Indians | 0.0 /100 | #293 | Tragic 49.9% |
| Immigrants | Cambodia | 0.0 /100 | #294 | Tragic 50.0% |
| Spanish Americans | 0.0 /100 | #295 | Tragic 50.0% |
| Mexican American Indians | 0.0 /100 | #296 | Tragic 50.0% |
| Armenians | 0.0 /100 | #297 | Tragic 50.0% |
| Marshallese | 0.0 /100 | #298 | Tragic 50.1% |
| Immigrants | Micronesia | 0.0 /100 | #299 | Tragic 50.1% |
| Cape Verdeans | 0.0 /100 | #300 | Tragic 50.1% |
| Dominicans | 0.0 /100 | #301 | Tragic 50.2% |
| Cherokee | 0.0 /100 | #302 | Tragic 50.2% |
| Japanese | 0.0 /100 | #303 | Tragic 50.2% |
| Immigrants | Dominican Republic | 0.0 /100 | #304 | Tragic 50.3% |
| Central American Indians | 0.0 /100 | #305 | Tragic 50.5% |
Demographics Similar to Immigrants from Ethiopia by Disability Age Over 75
In terms of disability age over 75, the demographic groups most similar to Immigrants from Ethiopia are Ethiopian (46.8%, a difference of 0.010%), English (46.8%, a difference of 0.020%), Immigrants from Venezuela (46.8%, a difference of 0.030%), Immigrants from Uganda (46.8%, a difference of 0.030%), and Immigrants from Bosnia and Herzegovina (46.8%, a difference of 0.040%).
| Demographics | Rating | Rank | Disability Age Over 75 |
| Syrians | 91.1 /100 | #127 | Exceptional 46.7% |
| Icelanders | 90.9 /100 | #128 | Exceptional 46.7% |
| Immigrants | Germany | 90.8 /100 | #129 | Exceptional 46.7% |
| Immigrants | Northern Africa | 90.7 /100 | #130 | Exceptional 46.7% |
| Scottish | 90.5 /100 | #131 | Exceptional 46.7% |
| South Americans | 90.0 /100 | #132 | Excellent 46.8% |
| English | 89.4 /100 | #133 | Excellent 46.8% |
| Immigrants | Ethiopia | 89.1 /100 | #134 | Excellent 46.8% |
| Ethiopians | 88.9 /100 | #135 | Excellent 46.8% |
| Immigrants | Venezuela | 88.6 /100 | #136 | Excellent 46.8% |
| Immigrants | Uganda | 88.5 /100 | #137 | Excellent 46.8% |
| Immigrants | Bosnia and Herzegovina | 88.5 /100 | #138 | Excellent 46.8% |
| Yugoslavians | 88.5 /100 | #139 | Excellent 46.8% |
| Immigrants | Costa Rica | 87.4 /100 | #140 | Excellent 46.8% |
| Lebanese | 87.0 /100 | #141 | Excellent 46.8% |