Maltese vs Hawaiian Disability Age Over 75
COMPARE
Maltese
Hawaiian
Disability Age Over 75
Disability Age Over 75 Comparison
Maltese
Hawaiians
45.8%
DISABILITY AGE OVER 75
99.6/ 100
METRIC RATING
55th/ 347
METRIC RANK
49.2%
DISABILITY AGE OVER 75
0.1/ 100
METRIC RATING
277th/ 347
METRIC RANK
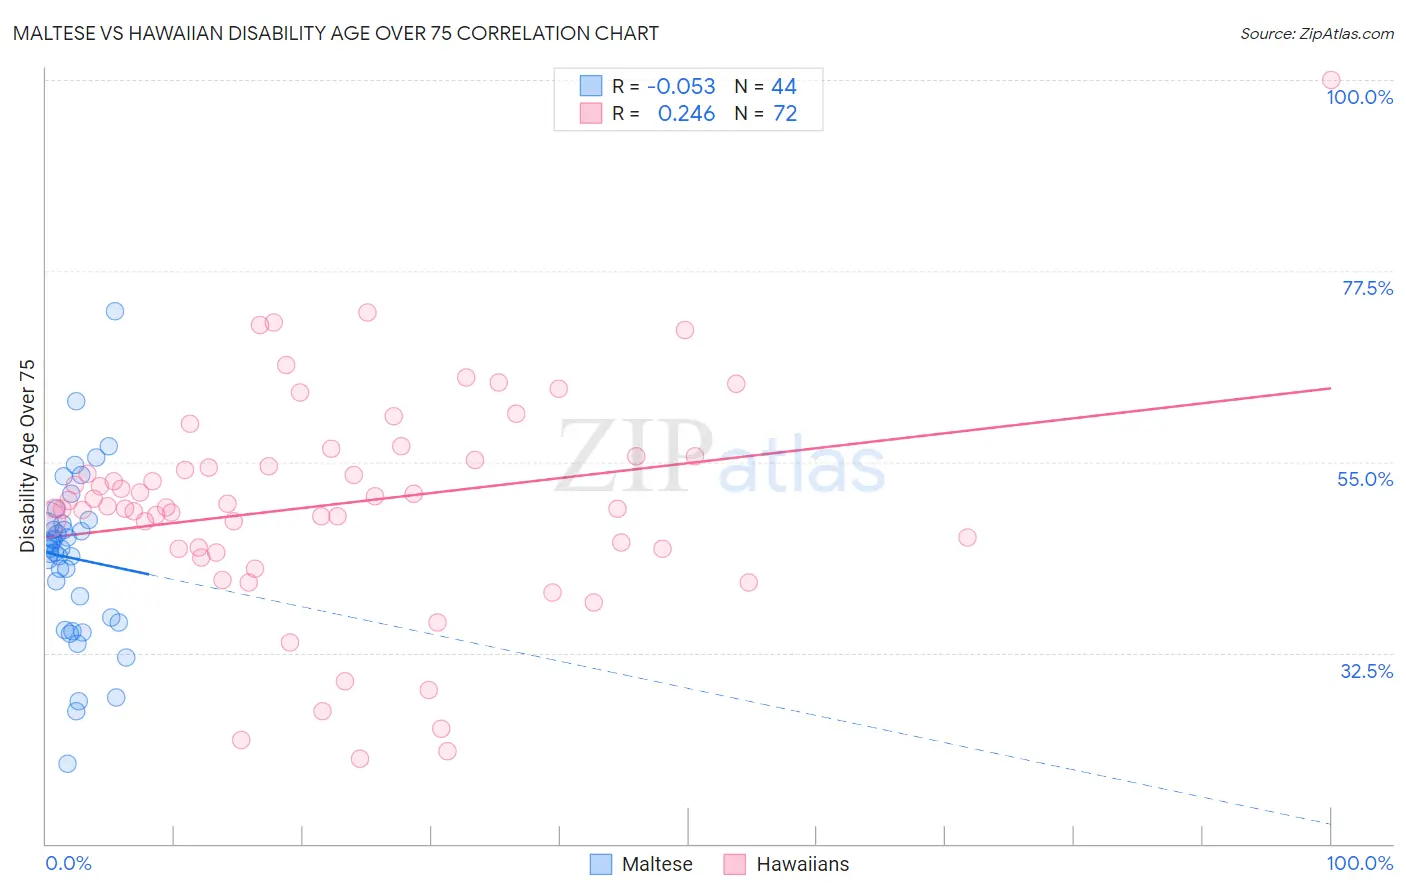
Maltese vs Hawaiian Disability Age Over 75 Correlation Chart
The statistical analysis conducted on geographies consisting of 126,418,061 people shows a slight negative correlation between the proportion of Maltese and percentage of population with a disability over the age of 75 in the United States with a correlation coefficient (R) of -0.053 and weighted average of 45.8%. Similarly, the statistical analysis conducted on geographies consisting of 326,769,462 people shows a weak positive correlation between the proportion of Hawaiians and percentage of population with a disability over the age of 75 in the United States with a correlation coefficient (R) of 0.246 and weighted average of 49.2%, a difference of 7.3%.
Disability Age Over 75 Correlation Summary
| Measurement | Maltese | Hawaiian |
| Minimum | 19.4% | 20.0% |
| Maximum | 72.8% | 100.0% |
| Range | 53.3% | 80.0% |
| Mean | 43.6% | 50.0% |
| Median | 44.8% | 49.6% |
| Interquartile 25% (IQ1) | 36.4% | 44.8% |
| Interquartile 75% (IQ3) | 47.7% | 55.5% |
| Interquartile Range (IQR) | 11.3% | 10.7% |
| Standard Deviation (Sample) | 9.8% | 13.1% |
| Standard Deviation (Population) | 9.7% | 13.0% |
Similar Demographics by Disability Age Over 75
Demographics Similar to Maltese by Disability Age Over 75
In terms of disability age over 75, the demographic groups most similar to Maltese are Slovak (45.8%, a difference of 0.0%), Immigrants from Netherlands (45.9%, a difference of 0.070%), Immigrants from Italy (45.8%, a difference of 0.080%), Immigrants from Turkey (45.9%, a difference of 0.080%), and Immigrants from Israel (45.9%, a difference of 0.080%).
| Demographics | Rating | Rank | Disability Age Over 75 |
| Croatians | 99.8 /100 | #48 | Exceptional 45.7% |
| Immigrants | North America | 99.8 /100 | #49 | Exceptional 45.7% |
| Belgians | 99.7 /100 | #50 | Exceptional 45.8% |
| Immigrants | Korea | 99.7 /100 | #51 | Exceptional 45.8% |
| Immigrants | France | 99.7 /100 | #52 | Exceptional 45.8% |
| Immigrants | Italy | 99.7 /100 | #53 | Exceptional 45.8% |
| Slovaks | 99.6 /100 | #54 | Exceptional 45.8% |
| Maltese | 99.6 /100 | #55 | Exceptional 45.8% |
| Immigrants | Netherlands | 99.6 /100 | #56 | Exceptional 45.9% |
| Immigrants | Turkey | 99.6 /100 | #57 | Exceptional 45.9% |
| Immigrants | Israel | 99.6 /100 | #58 | Exceptional 45.9% |
| Iranians | 99.6 /100 | #59 | Exceptional 45.9% |
| Immigrants | Europe | 99.6 /100 | #60 | Exceptional 45.9% |
| Immigrants | Argentina | 99.6 /100 | #61 | Exceptional 45.9% |
| Burmese | 99.5 /100 | #62 | Exceptional 45.9% |
Demographics Similar to Hawaiians by Disability Age Over 75
In terms of disability age over 75, the demographic groups most similar to Hawaiians are Immigrants from Uzbekistan (49.2%, a difference of 0.020%), Immigrants from Laos (49.2%, a difference of 0.030%), Immigrants from Dominica (49.1%, a difference of 0.14%), Immigrants from Guatemala (49.1%, a difference of 0.15%), and Immigrants from Iraq (49.1%, a difference of 0.22%).
| Demographics | Rating | Rank | Disability Age Over 75 |
| Potawatomi | 0.2 /100 | #270 | Tragic 49.0% |
| Fijians | 0.2 /100 | #271 | Tragic 49.0% |
| Assyrians/Chaldeans/Syriacs | 0.2 /100 | #272 | Tragic 49.1% |
| Immigrants | Iraq | 0.1 /100 | #273 | Tragic 49.1% |
| Immigrants | Guatemala | 0.1 /100 | #274 | Tragic 49.1% |
| Immigrants | Dominica | 0.1 /100 | #275 | Tragic 49.1% |
| Immigrants | Uzbekistan | 0.1 /100 | #276 | Tragic 49.2% |
| Hawaiians | 0.1 /100 | #277 | Tragic 49.2% |
| Immigrants | Laos | 0.1 /100 | #278 | Tragic 49.2% |
| Guamanians/Chamorros | 0.0 /100 | #279 | Tragic 49.4% |
| Bangladeshis | 0.0 /100 | #280 | Tragic 49.4% |
| Belizeans | 0.0 /100 | #281 | Tragic 49.4% |
| Blacks/African Americans | 0.0 /100 | #282 | Tragic 49.5% |
| Samoans | 0.0 /100 | #283 | Tragic 49.5% |
| Immigrants | Latin America | 0.0 /100 | #284 | Tragic 49.5% |