Luxembourger vs Immigrants from Iran Ambulatory Disability

COMPARE

Luxembourger
Race
Ancestry
AfghanAfricanAlaska NativeAlaskan AthabascanAlbanianAleutAlsatianAmericanApacheArabArapahoArgentineanArmenianAssyrian/Chaldean/SyriacAustralianAustrianBahamianBangladeshiBarbadianBasqueBelgianBelizeanBermudanBhutaneseBlackfeetBolivianBrazilianBritishBritish West IndianBulgarianBurmeseCajunCambodianCanadianCape VerdeanCarpatho RusynCelticCentral AmericanCentral American IndianCherokeeCheyenneChickasawChileanChineseChippewaChoctawColombianColvilleComancheCosta RicanCreeCreekCroatianCrowCubanCypriotCzechCzechoslovakianDanishDelawareDominicanDutchDutch West IndianEastern EuropeanEcuadorianEgyptianEnglishEstonianEthiopianEuropeanFijianFilipinoFinnishFrenchFrench American IndianFrench CanadianGermanGerman RussianGhanaianGreekGuamanian/ChamorroGuatemalanGuyaneseHaitianHmongHonduranHopiHoumaHungarianIcelanderIndian (Asian)IndonesianInupiatIranianIraqiIrishIroquoisIsraeliItalianJamaicanJapaneseJordanianKenyanKiowaKoreanLaotianLatvianLebaneseLiberianLithuanianLumbeeLuxembourgerMacedonianMalaysianMalteseMarshalleseMenomineeMexicanMexican American IndianMongolianMoroccanNative HawaiianNavajoNepaleseNew ZealanderNicaraguanNigerianNorthern EuropeanNorwegianOkinawanOsageOttawaPaiutePakistaniPalestinianPanamanianParaguayanPennsylvania GermanPeruvianPimaPolishPortuguesePotawatomiPuebloPuerto RicanPuget Sound SalishRomanianRussianSalvadoranSamoanScandinavianScotch-IrishScottishSeminoleSenegaleseSerbianShoshoneSierra LeoneanSiouxSlavicSlovakSloveneSomaliSouth AfricanSouth AmericanSouth American IndianSoviet UnionSpaniardSpanishSpanish AmericanSpanish American IndianSri LankanSubsaharan AfricanSudaneseSwedishSwissSyrianTaiwaneseThaiTlingit-HaidaTohono O'OdhamTonganTrinidadian and TobagonianTsimshianTurkishU.S. Virgin IslanderUgandanUkrainianUruguayanUteVenezuelanVietnameseWelshWest IndianYakamaYaquiYugoslavianYumanYup'ikZimbabwean
Immigration
NonimmigrantsImmigrantsAfghanistanAfricaAlbaniaArgentinaArmeniaAsiaAustraliaAustriaBahamasBangladeshBarbadosBelarusBelgiumBelizeBoliviaBosnia and HerzegovinaBrazilBulgariaBurma/MyanmarCabo VerdeCambodiaCameroonCanadaCaribbeanCentral AmericaChileChinaColombiaCongoCosta RicaCroatiaCubaCzechoslovakiaDenmarkDominicaDominican RepublicEastern AfricaEastern AsiaEastern EuropeEcuadorEgyptEl SalvadorEnglandEritreaEthiopiaEuropeFijiFranceGermanyGhanaGreeceGrenadaGuatemalaGuyanaHaitiHondurasHong KongHungaryIndiaIndonesiaIraqIrelandIsraelItalyJamaicaJapanJordanKazakhstanKenyaKoreaKuwaitLaosLatin AmericaLatviaLebanonLiberiaLithuaniaMalaysiaMexicoMicronesiaMiddle AfricaMoldovaMoroccoNepalNetherlandsNicaraguaNigeriaNorth AmericaNorth MacedoniaNorthern AfricaNorthern EuropeNorwayOceaniaPakistanPanamaPeruPhilippinesPolandPortugalRomaniaRussiaSaudi ArabiaScotlandSenegalSerbiaSierra LeoneSingaporeSomaliaSouth AfricaSouth AmericaSouth Central AsiaSouth Eastern AsiaSouthern EuropeSpainSri LankaSt. Vincent and the GrenadinesSudanSwedenSwitzerlandSyriaTaiwanThailandTrinidad and TobagoTurkeyUgandaUkraineUruguayUzbekistanVenezuelaVietnamWest IndiesWestern AfricaWestern AsiaWestern EuropeYemenZaireZimbabweAzores
Immigrants from Iran
Race
Ancestry
AfghanAfricanAlaska NativeAlaskan AthabascanAlbanianAleutAlsatianAmericanApacheArabArapahoArgentineanArmenianAssyrian/Chaldean/SyriacAustralianAustrianBahamianBangladeshiBarbadianBasqueBelgianBelizeanBermudanBhutaneseBlackfeetBolivianBrazilianBritishBritish West IndianBulgarianBurmeseCajunCambodianCanadianCape VerdeanCarpatho RusynCelticCentral AmericanCentral American IndianCherokeeCheyenneChickasawChileanChineseChippewaChoctawColombianColvilleComancheCosta RicanCreeCreekCroatianCrowCubanCypriotCzechCzechoslovakianDanishDelawareDominicanDutchDutch West IndianEastern EuropeanEcuadorianEgyptianEnglishEstonianEthiopianEuropeanFijianFilipinoFinnishFrenchFrench American IndianFrench CanadianGermanGerman RussianGhanaianGreekGuamanian/ChamorroGuatemalanGuyaneseHaitianHmongHonduranHopiHoumaHungarianIcelanderIndian (Asian)IndonesianInupiatIranianIraqiIrishIroquoisIsraeliItalianJamaicanJapaneseJordanianKenyanKiowaKoreanLaotianLatvianLebaneseLiberianLithuanianLumbeeMacedonianMalaysianMalteseMarshalleseMenomineeMexicanMexican American IndianMongolianMoroccanNative HawaiianNavajoNepaleseNew ZealanderNicaraguanNigerianNorthern EuropeanNorwegianOkinawanOsageOttawaPaiutePakistaniPalestinianPanamanianParaguayanPennsylvania GermanPeruvianPimaPolishPortuguesePotawatomiPuebloPuerto RicanPuget Sound SalishRomanianRussianSalvadoranSamoanScandinavianScotch-IrishScottishSeminoleSenegaleseSerbianShoshoneSierra LeoneanSiouxSlavicSlovakSloveneSomaliSouth AfricanSouth AmericanSouth American IndianSoviet UnionSpaniardSpanishSpanish AmericanSpanish American IndianSri LankanSubsaharan AfricanSudaneseSwedishSwissSyrianTaiwaneseThaiTlingit-HaidaTohono O'OdhamTonganTrinidadian and TobagonianTsimshianTurkishU.S. Virgin IslanderUgandanUkrainianUruguayanUteVenezuelanVietnameseWelshWest IndianYakamaYaquiYugoslavianYumanYup'ikZimbabwean
Immigration
NonimmigrantsImmigrantsAfghanistanAfricaAlbaniaArgentinaArmeniaAsiaAustraliaAustriaBahamasBangladeshBarbadosBelarusBelgiumBelizeBoliviaBosnia and HerzegovinaBrazilBulgariaBurma/MyanmarCabo VerdeCambodiaCameroonCanadaCaribbeanCentral AmericaChileChinaColombiaCongoCosta RicaCroatiaCubaCzechoslovakiaDenmarkDominicaDominican RepublicEastern AfricaEastern AsiaEastern EuropeEcuadorEgyptEl SalvadorEnglandEritreaEthiopiaEuropeFijiFranceGermanyGhanaGreeceGrenadaGuatemalaGuyanaHaitiHondurasHong KongHungaryIndiaIndonesiaIranIraqIrelandIsraelItalyJamaicaJapanJordanKazakhstanKenyaKoreaKuwaitLaosLatin AmericaLatviaLebanonLiberiaLithuaniaMalaysiaMexicoMicronesiaMiddle AfricaMoldovaMoroccoNepalNetherlandsNicaraguaNigeriaNorth AmericaNorth MacedoniaNorthern AfricaNorthern EuropeNorwayOceaniaPakistanPanamaPeruPhilippinesPolandPortugalRomaniaRussiaSaudi ArabiaScotlandSenegalSerbiaSierra LeoneSingaporeSomaliaSouth AfricaSouth AmericaSouth Central AsiaSouth Eastern AsiaSouthern EuropeSpainSri LankaSt. Vincent and the GrenadinesSudanSwedenSwitzerlandSyriaTaiwanThailandTrinidad and TobagoTurkeyUgandaUkraineUruguayUzbekistanVenezuelaVietnamWest IndiesWestern AfricaWestern AsiaWestern EuropeYemenZaireZimbabweAzores
Ambulatory Disability
Income
Poverty
Unemployment
Labor Participation
Family Structure
Vehicle Availability
Education Level
Disability

Ambulatory Disability Comparison

Luxembourgers

Immigrants from Iran

Exceptional
Exceptional
5.6%
AMBULATORY DISABILITY
99.9/ 100
METRIC RATING
50th/ 347
METRIC RANK
5.4%
AMBULATORY DISABILITY
100.0/ 100
METRIC RATING
29th/ 347
METRIC RANK

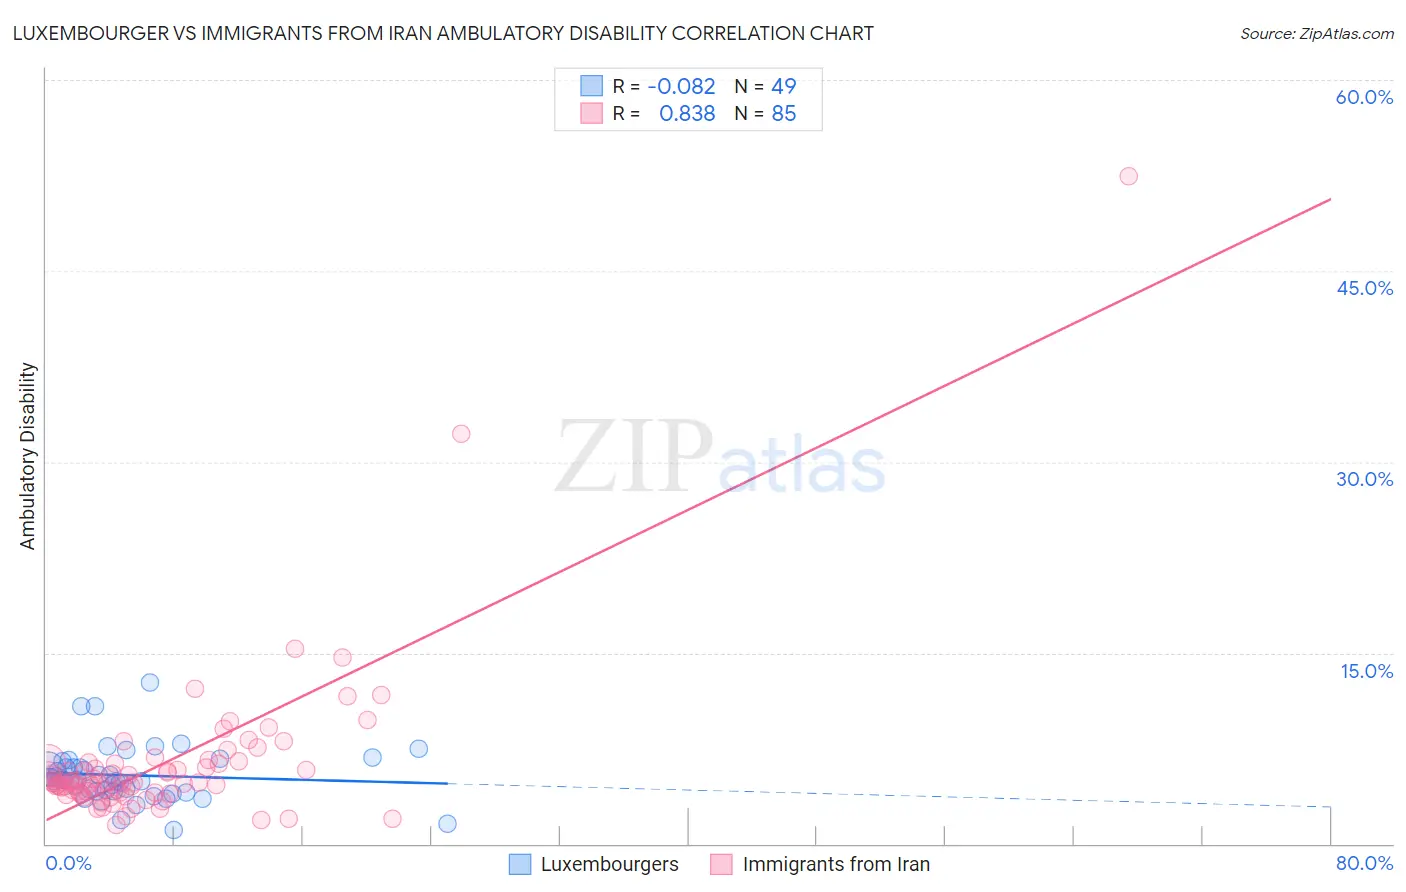
Luxembourger vs Immigrants from Iran Ambulatory Disability Correlation Chart

The statistical analysis conducted on geographies consisting of 144,679,340 people shows a slight negative correlation between the proportion of Luxembourgers and percentage of population with ambulatory disability in the United States with a correlation coefficient (R) of -0.082 and weighted average of 5.6%. Similarly, the statistical analysis conducted on geographies consisting of 279,879,747 people shows a very strong positive correlation between the proportion of Immigrants from Iran and percentage of population with ambulatory disability in the United States with a correlation coefficient (R) of 0.838 and weighted average of 5.4%, a difference of 3.2%.
Luxembourger vs Immigrants from Iran Ambulatory Disability

Ambulatory Disability Correlation Summary

MeasurementLuxembourgerImmigrants from Iran
Minimum1.1%1.5%
Maximum12.6%52.5%
Range11.5%51.0%
Mean5.4%6.3%
Median5.0%4.8%
Interquartile 25% (IQ1)4.1%4.0%
Interquartile 75% (IQ3)6.3%6.3%
Interquartile Range (IQR)2.1%2.3%
Standard Deviation (Sample)2.2%6.4%
Standard Deviation (Population)2.1%6.3%

Similar Demographics by Ambulatory Disability

Demographics Similar to Luxembourgers by Ambulatory Disability

In terms of ambulatory disability, the demographic groups most similar to Luxembourgers are Taiwanese (5.6%, a difference of 0.10%), Jordanian (5.6%, a difference of 0.19%), Immigrants from Egypt (5.6%, a difference of 0.20%), Immigrants from Eastern Africa (5.6%, a difference of 0.25%), and Immigrants from Bulgaria (5.6%, a difference of 0.31%).
DemographicsRating | RankAmbulatory Disability
Paraguayans
99.9
/100
|
#43
Exceptional
5.5%
Immigrants | Indonesia
99.9
/100
|
#44
Exceptional
5.5%
Immigrants | Sweden
99.9
/100
|
#45
Exceptional
5.6%
Egyptians
99.9
/100
|
#46
Exceptional
5.6%
Immigrants | Japan
99.9
/100
|
#47
Exceptional
5.6%
Immigrants | Argentina
99.9
/100
|
#48
Exceptional
5.6%
Bulgarians
99.9
/100
|
#49
Exceptional
5.6%
Luxembourgers
99.9
/100
|
#50
Exceptional
5.6%
Taiwanese
99.8
/100
|
#51
Exceptional
5.6%
Jordanians
99.8
/100
|
#52
Exceptional
5.6%
Immigrants | Egypt
99.8
/100
|
#53
Exceptional
5.6%
Immigrants | Eastern Africa
99.8
/100
|
#54
Exceptional
5.6%
Immigrants | Bulgaria
99.8
/100
|
#55
Exceptional
5.6%
Inupiat
99.8
/100
|
#56
Exceptional
5.6%
Immigrants | Brazil
99.8
/100
|
#57
Exceptional
5.6%

Demographics Similar to Immigrants from Iran by Ambulatory Disability

In terms of ambulatory disability, the demographic groups most similar to Immigrants from Iran are Cambodian (5.4%, a difference of 0.10%), Asian (5.4%, a difference of 0.16%), Immigrants from Nepal (5.4%, a difference of 0.32%), Zimbabwean (5.4%, a difference of 0.35%), and Immigrants from Saudi Arabia (5.4%, a difference of 0.43%).
DemographicsRating | RankAmbulatory Disability
Immigrants | Israel
100.0
/100
|
#22
Exceptional
5.4%
Tongans
100.0
/100
|
#23
Exceptional
5.4%
Immigrants | Saudi Arabia
100.0
/100
|
#24
Exceptional
5.4%
Zimbabweans
100.0
/100
|
#25
Exceptional
5.4%
Immigrants | Nepal
100.0
/100
|
#26
Exceptional
5.4%
Asians
100.0
/100
|
#27
Exceptional
5.4%
Cambodians
100.0
/100
|
#28
Exceptional
5.4%
Immigrants | Iran
100.0
/100
|
#29
Exceptional
5.4%
Immigrants | Turkey
100.0
/100
|
#30
Exceptional
5.4%
Immigrants | Venezuela
100.0
/100
|
#31
Exceptional
5.4%
Immigrants | Australia
100.0
/100
|
#32
Exceptional
5.5%
Immigrants | Pakistan
100.0
/100
|
#33
Exceptional
5.5%
Immigrants | Asia
100.0
/100
|
#34
Exceptional
5.5%
Afghans
100.0
/100
|
#35
Exceptional
5.5%
Immigrants | Malaysia
100.0
/100
|
#36
Exceptional
5.5%