Luxembourger vs Immigrants from Czechoslovakia Vision Disability
COMPARE
Luxembourger
Immigrants from Czechoslovakia
Vision Disability
Vision Disability Comparison
Luxembourgers
Immigrants from Czechoslovakia
1.9%
VISION DISABILITY
99.9/ 100
METRIC RATING
32nd/ 347
METRIC RANK
2.0%
VISION DISABILITY
98.7/ 100
METRIC RATING
68th/ 347
METRIC RANK
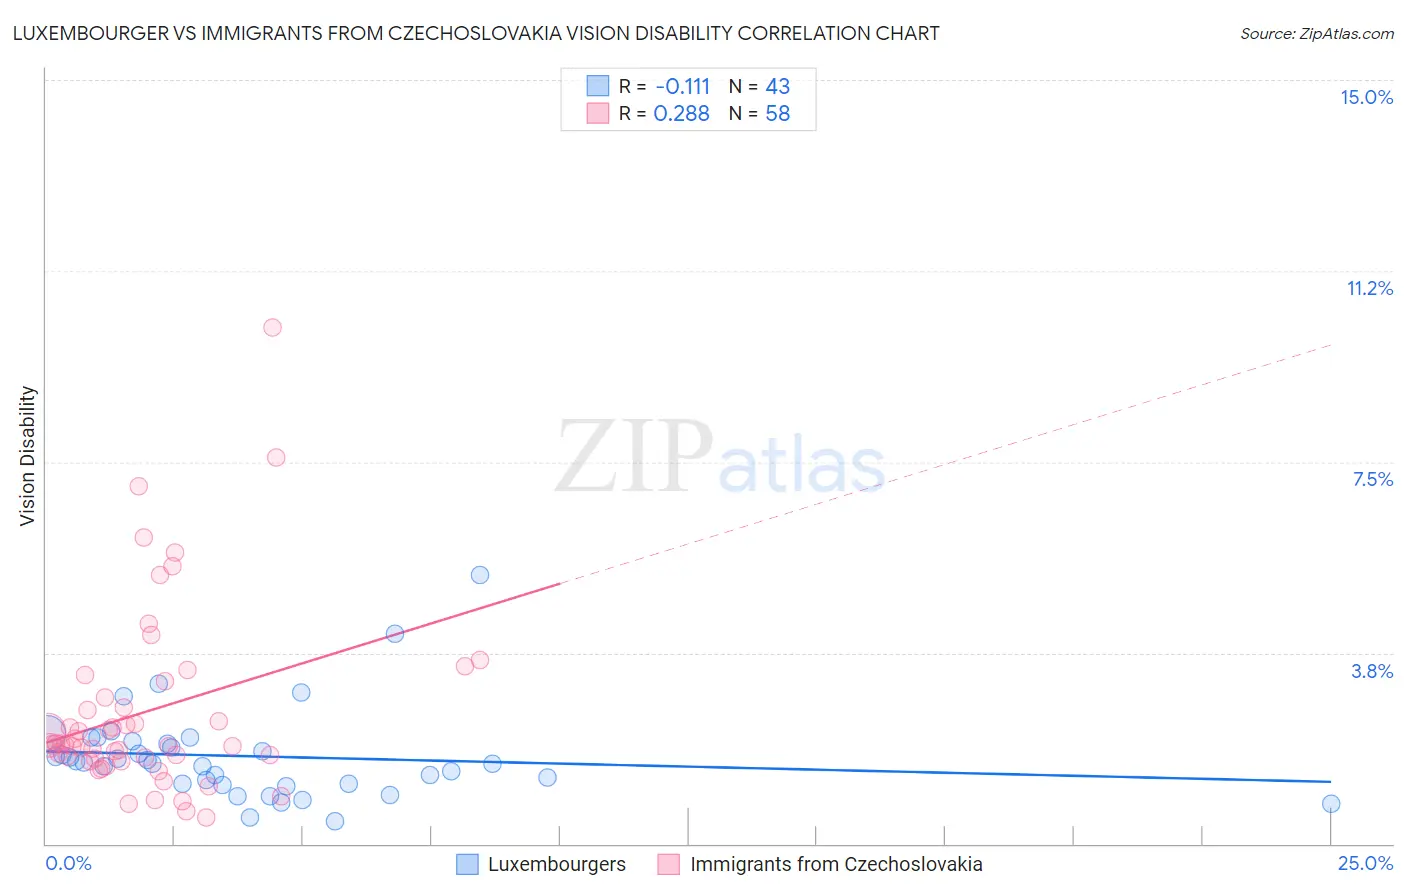
Luxembourger vs Immigrants from Czechoslovakia Vision Disability Correlation Chart
The statistical analysis conducted on geographies consisting of 144,652,316 people shows a poor negative correlation between the proportion of Luxembourgers and percentage of population with vision disability in the United States with a correlation coefficient (R) of -0.111 and weighted average of 1.9%. Similarly, the statistical analysis conducted on geographies consisting of 195,413,823 people shows a weak positive correlation between the proportion of Immigrants from Czechoslovakia and percentage of population with vision disability in the United States with a correlation coefficient (R) of 0.288 and weighted average of 2.0%, a difference of 4.1%.
Vision Disability Correlation Summary
| Measurement | Luxembourger | Immigrants from Czechoslovakia |
| Minimum | 0.43% | 0.52% |
| Maximum | 5.3% | 10.1% |
| Range | 4.8% | 9.6% |
| Mean | 1.7% | 2.6% |
| Median | 1.6% | 1.9% |
| Interquartile 25% (IQ1) | 1.2% | 1.7% |
| Interquartile 75% (IQ3) | 2.0% | 2.9% |
| Interquartile Range (IQR) | 0.84% | 1.2% |
| Standard Deviation (Sample) | 0.90% | 1.8% |
| Standard Deviation (Population) | 0.89% | 1.8% |
Similar Demographics by Vision Disability
Demographics Similar to Luxembourgers by Vision Disability
In terms of vision disability, the demographic groups most similar to Luxembourgers are Mongolian (1.9%, a difference of 0.27%), Immigrants from Egypt (1.9%, a difference of 0.31%), Immigrants from Nepal (1.9%, a difference of 0.43%), Immigrants from Turkey (1.9%, a difference of 0.43%), and Egyptian (1.9%, a difference of 0.47%).
| Demographics | Rating | Rank | Vision Disability |
| Bulgarians | 99.9 /100 | #25 | Exceptional 1.9% |
| Immigrants | Japan | 99.9 /100 | #26 | Exceptional 1.9% |
| Taiwanese | 99.9 /100 | #27 | Exceptional 1.9% |
| Immigrants | Malaysia | 99.9 /100 | #28 | Exceptional 1.9% |
| Egyptians | 99.9 /100 | #29 | Exceptional 1.9% |
| Immigrants | Nepal | 99.9 /100 | #30 | Exceptional 1.9% |
| Mongolians | 99.9 /100 | #31 | Exceptional 1.9% |
| Luxembourgers | 99.9 /100 | #32 | Exceptional 1.9% |
| Immigrants | Egypt | 99.9 /100 | #33 | Exceptional 1.9% |
| Immigrants | Turkey | 99.8 /100 | #34 | Exceptional 1.9% |
| Immigrants | Australia | 99.8 /100 | #35 | Exceptional 1.9% |
| Cambodians | 99.8 /100 | #36 | Exceptional 2.0% |
| Bhutanese | 99.8 /100 | #37 | Exceptional 2.0% |
| Immigrants | Kuwait | 99.8 /100 | #38 | Exceptional 2.0% |
| Zimbabweans | 99.7 /100 | #39 | Exceptional 2.0% |
Demographics Similar to Immigrants from Czechoslovakia by Vision Disability
In terms of vision disability, the demographic groups most similar to Immigrants from Czechoslovakia are Immigrants from Northern Africa (2.0%, a difference of 0.10%), Russian (2.0%, a difference of 0.17%), Immigrants from Kazakhstan (2.0%, a difference of 0.19%), Immigrants from Northern Europe (2.0%, a difference of 0.20%), and Immigrants from Argentina (2.0%, a difference of 0.21%).
| Demographics | Rating | Rank | Vision Disability |
| Immigrants | Belgium | 99.1 /100 | #61 | Exceptional 2.0% |
| Immigrants | Russia | 99.1 /100 | #62 | Exceptional 2.0% |
| Armenians | 99.0 /100 | #63 | Exceptional 2.0% |
| Immigrants | Greece | 99.0 /100 | #64 | Exceptional 2.0% |
| Maltese | 98.9 /100 | #65 | Exceptional 2.0% |
| Immigrants | Argentina | 98.9 /100 | #66 | Exceptional 2.0% |
| Immigrants | Northern Africa | 98.8 /100 | #67 | Exceptional 2.0% |
| Immigrants | Czechoslovakia | 98.7 /100 | #68 | Exceptional 2.0% |
| Russians | 98.6 /100 | #69 | Exceptional 2.0% |
| Immigrants | Kazakhstan | 98.6 /100 | #70 | Exceptional 2.0% |
| Immigrants | Northern Europe | 98.6 /100 | #71 | Exceptional 2.0% |
| Immigrants | France | 98.5 /100 | #72 | Exceptional 2.0% |
| Immigrants | Eritrea | 98.4 /100 | #73 | Exceptional 2.0% |
| Palestinians | 98.3 /100 | #74 | Exceptional 2.0% |
| Immigrants | North Macedonia | 98.3 /100 | #75 | Exceptional 2.0% |