Lithuanian vs Apache Disability Age 18 to 34
COMPARE
Lithuanian
Apache
Disability Age 18 to 34
Disability Age 18 to 34 Comparison
Lithuanians
Apache
7.0%
DISABILITY AGE 18 TO 34
4.1/ 100
METRIC RATING
229th/ 347
METRIC RANK
8.4%
DISABILITY AGE 18 TO 34
0.0/ 100
METRIC RATING
333rd/ 347
METRIC RANK
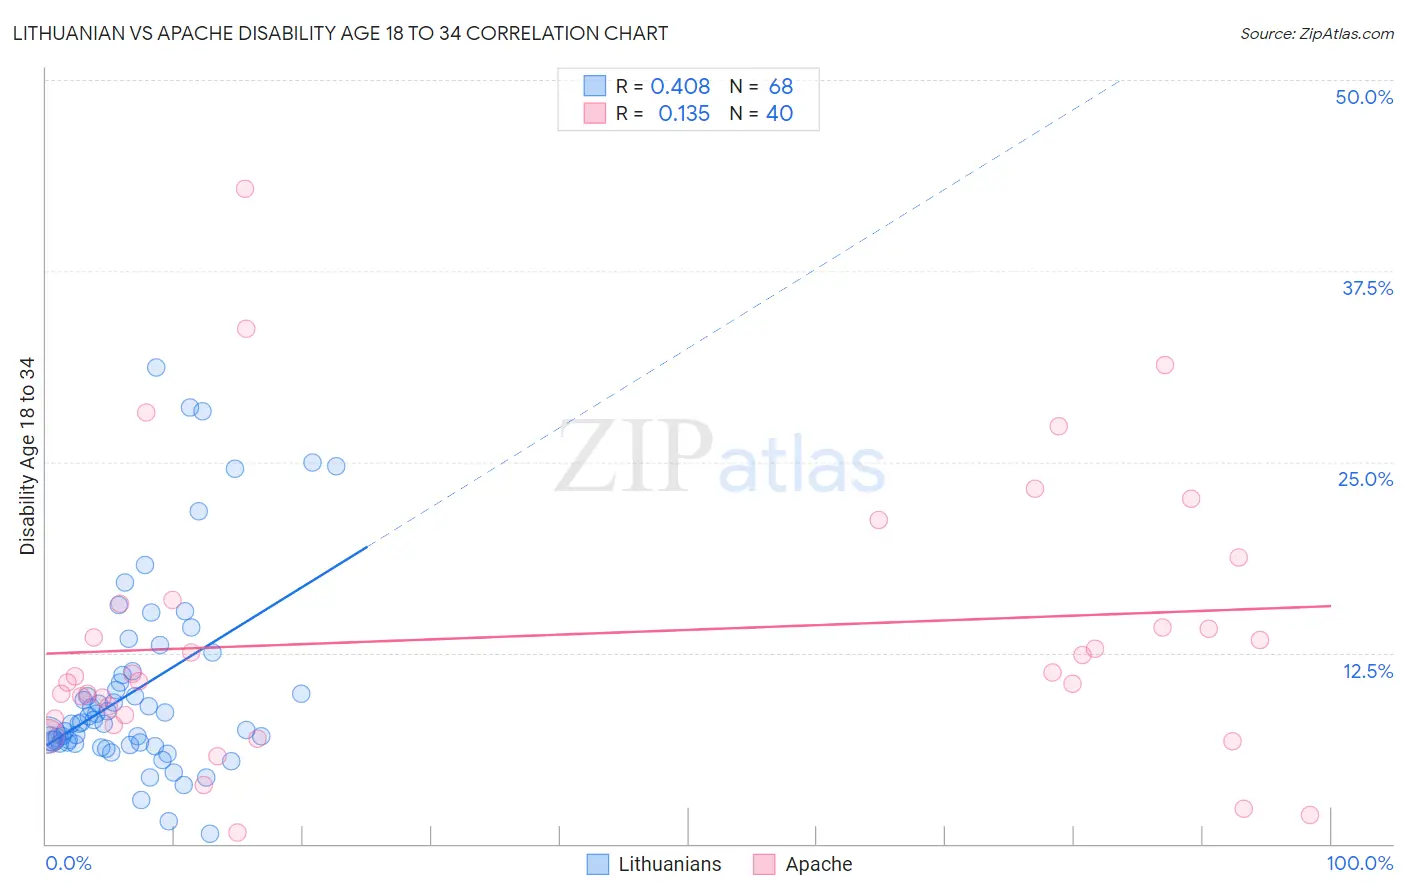
Lithuanian vs Apache Disability Age 18 to 34 Correlation Chart
The statistical analysis conducted on geographies consisting of 420,363,620 people shows a moderate positive correlation between the proportion of Lithuanians and percentage of population with a disability between the ages 18 and 35 in the United States with a correlation coefficient (R) of 0.408 and weighted average of 7.0%. Similarly, the statistical analysis conducted on geographies consisting of 230,768,782 people shows a poor positive correlation between the proportion of Apache and percentage of population with a disability between the ages 18 and 35 in the United States with a correlation coefficient (R) of 0.135 and weighted average of 8.4%, a difference of 20.9%.
Disability Age 18 to 34 Correlation Summary
| Measurement | Lithuanian | Apache |
| Minimum | 0.63% | 0.77% |
| Maximum | 31.1% | 42.9% |
| Range | 30.5% | 42.1% |
| Mean | 10.2% | 13.6% |
| Median | 7.9% | 11.0% |
| Interquartile 25% (IQ1) | 6.6% | 8.3% |
| Interquartile 75% (IQ3) | 11.2% | 15.8% |
| Interquartile Range (IQR) | 4.6% | 7.6% |
| Standard Deviation (Sample) | 6.5% | 9.0% |
| Standard Deviation (Population) | 6.4% | 8.9% |
Similar Demographics by Disability Age 18 to 34
Demographics Similar to Lithuanians by Disability Age 18 to 34
In terms of disability age 18 to 34, the demographic groups most similar to Lithuanians are Immigrants from Yemen (7.0%, a difference of 0.030%), Immigrants from Canada (7.0%, a difference of 0.080%), Immigrants from North America (7.0%, a difference of 0.090%), Ute (7.0%, a difference of 0.11%), and Ugandan (6.9%, a difference of 0.13%).
| Demographics | Rating | Rank | Disability Age 18 to 34 |
| Immigrants | England | 5.3 /100 | #222 | Tragic 6.9% |
| Carpatho Rusyns | 5.2 /100 | #223 | Tragic 6.9% |
| Senegalese | 4.9 /100 | #224 | Tragic 6.9% |
| Central American Indians | 4.7 /100 | #225 | Tragic 6.9% |
| Ugandans | 4.4 /100 | #226 | Tragic 6.9% |
| Immigrants | Canada | 4.3 /100 | #227 | Tragic 7.0% |
| Immigrants | Yemen | 4.2 /100 | #228 | Tragic 7.0% |
| Lithuanians | 4.1 /100 | #229 | Tragic 7.0% |
| Immigrants | North America | 3.9 /100 | #230 | Tragic 7.0% |
| Ute | 3.8 /100 | #231 | Tragic 7.0% |
| Samoans | 3.2 /100 | #232 | Tragic 7.0% |
| New Zealanders | 2.7 /100 | #233 | Tragic 7.0% |
| Alsatians | 2.1 /100 | #234 | Tragic 7.0% |
| Sub-Saharan Africans | 1.7 /100 | #235 | Tragic 7.1% |
| Liberians | 1.5 /100 | #236 | Tragic 7.1% |
Demographics Similar to Apache by Disability Age 18 to 34
In terms of disability age 18 to 34, the demographic groups most similar to Apache are Dutch West Indian (8.4%, a difference of 0.21%), Seminole (8.4%, a difference of 0.33%), Puget Sound Salish (8.3%, a difference of 1.1%), Comanche (8.3%, a difference of 1.3%), and Osage (8.3%, a difference of 1.5%).
| Demographics | Rating | Rank | Disability Age 18 to 34 |
| Potawatomi | 0.0 /100 | #326 | Tragic 8.2% |
| Sioux | 0.0 /100 | #327 | Tragic 8.2% |
| Delaware | 0.0 /100 | #328 | Tragic 8.2% |
| Crow | 0.0 /100 | #329 | Tragic 8.3% |
| Osage | 0.0 /100 | #330 | Tragic 8.3% |
| Comanche | 0.0 /100 | #331 | Tragic 8.3% |
| Puget Sound Salish | 0.0 /100 | #332 | Tragic 8.3% |
| Apache | 0.0 /100 | #333 | Tragic 8.4% |
| Dutch West Indians | 0.0 /100 | #334 | Tragic 8.4% |
| Seminole | 0.0 /100 | #335 | Tragic 8.4% |
| Immigrants | Azores | 0.0 /100 | #336 | Tragic 8.5% |
| Ottawa | 0.0 /100 | #337 | Tragic 8.6% |
| Cherokee | 0.0 /100 | #338 | Tragic 8.7% |
| Kiowa | 0.0 /100 | #339 | Tragic 8.8% |
| Choctaw | 0.0 /100 | #340 | Tragic 9.0% |