Laotian vs Immigrants from Western Africa Disability Age 65 to 74
COMPARE
Laotian
Immigrants from Western Africa
Disability Age 65 to 74
Disability Age 65 to 74 Comparison
Laotians
Immigrants from Western Africa
22.3%
DISABILITY AGE 65 TO 74
94.9/ 100
METRIC RATING
115th/ 347
METRIC RANK
24.6%
DISABILITY AGE 65 TO 74
2.3/ 100
METRIC RATING
241st/ 347
METRIC RANK
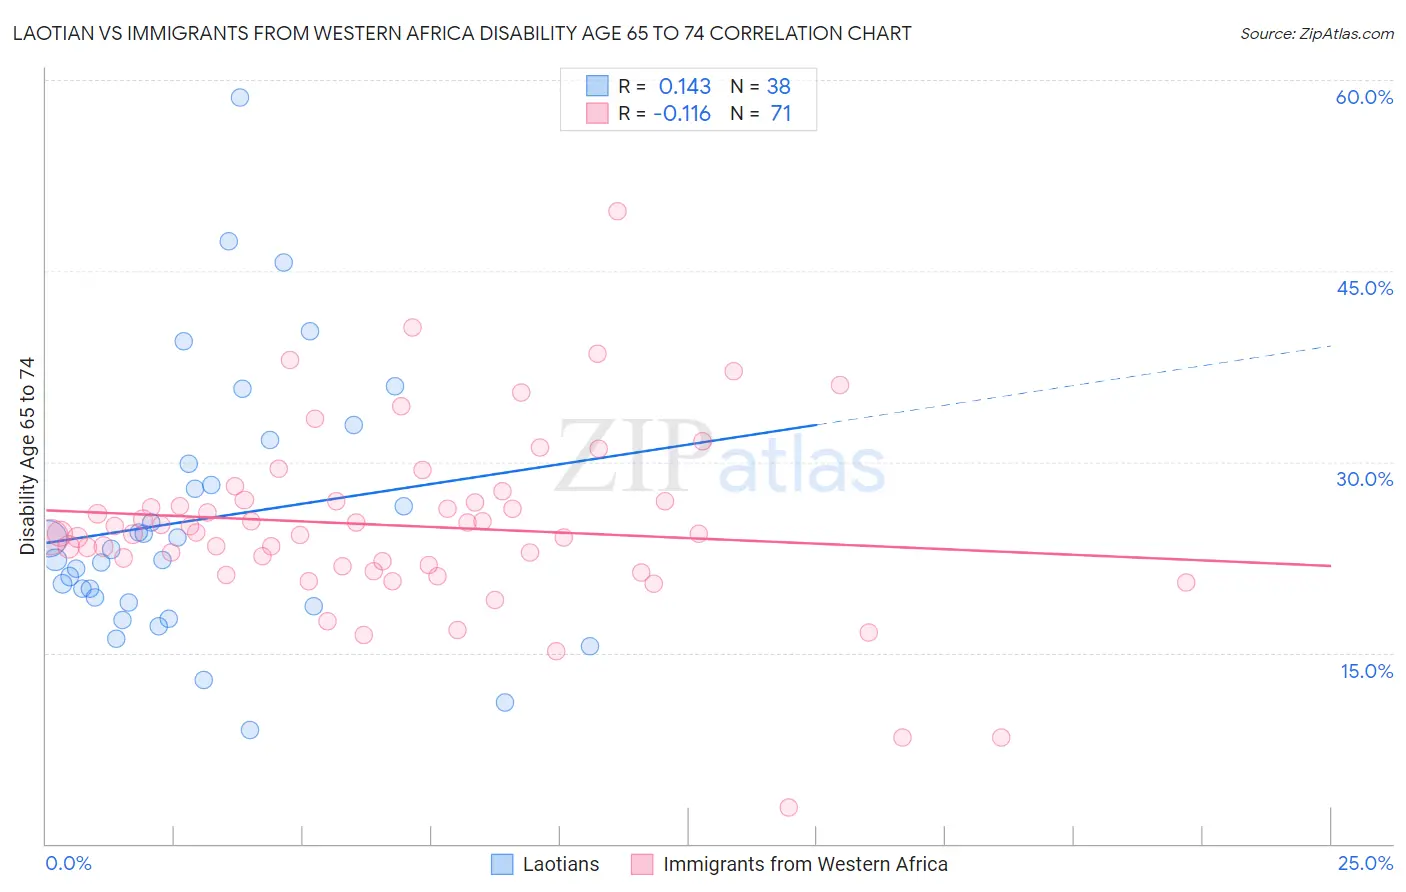
Laotian vs Immigrants from Western Africa Disability Age 65 to 74 Correlation Chart
The statistical analysis conducted on geographies consisting of 224,537,885 people shows a poor positive correlation between the proportion of Laotians and percentage of population with a disability between the ages 65 and 75 in the United States with a correlation coefficient (R) of 0.143 and weighted average of 22.3%. Similarly, the statistical analysis conducted on geographies consisting of 356,971,422 people shows a poor negative correlation between the proportion of Immigrants from Western Africa and percentage of population with a disability between the ages 65 and 75 in the United States with a correlation coefficient (R) of -0.116 and weighted average of 24.6%, a difference of 10.1%.
Disability Age 65 to 74 Correlation Summary
| Measurement | Laotian | Immigrants from Western Africa |
| Minimum | 8.9% | 2.8% |
| Maximum | 58.7% | 49.7% |
| Range | 49.8% | 46.8% |
| Mean | 25.5% | 25.0% |
| Median | 22.7% | 24.3% |
| Interquartile 25% (IQ1) | 19.0% | 21.8% |
| Interquartile 75% (IQ3) | 29.9% | 26.9% |
| Interquartile Range (IQR) | 10.9% | 5.1% |
| Standard Deviation (Sample) | 10.5% | 7.2% |
| Standard Deviation (Population) | 10.3% | 7.1% |
Similar Demographics by Disability Age 65 to 74
Demographics Similar to Laotians by Disability Age 65 to 74
In terms of disability age 65 to 74, the demographic groups most similar to Laotians are Brazilian (22.4%, a difference of 0.040%), Swedish (22.4%, a difference of 0.050%), Ukrainian (22.3%, a difference of 0.060%), Austrian (22.4%, a difference of 0.060%), and Immigrants from Northern Africa (22.4%, a difference of 0.060%).
| Demographics | Rating | Rank | Disability Age 65 to 74 |
| Immigrants | Zimbabwe | 96.1 /100 | #108 | Exceptional 22.3% |
| Albanians | 95.8 /100 | #109 | Exceptional 22.3% |
| Immigrants | Peru | 95.7 /100 | #110 | Exceptional 22.3% |
| Serbians | 95.7 /100 | #111 | Exceptional 22.3% |
| Immigrants | South America | 95.5 /100 | #112 | Exceptional 22.3% |
| Syrians | 95.3 /100 | #113 | Exceptional 22.3% |
| Ukrainians | 95.1 /100 | #114 | Exceptional 22.3% |
| Laotians | 94.9 /100 | #115 | Exceptional 22.3% |
| Brazilians | 94.8 /100 | #116 | Exceptional 22.4% |
| Swedes | 94.7 /100 | #117 | Exceptional 22.4% |
| Austrians | 94.7 /100 | #118 | Exceptional 22.4% |
| Immigrants | Northern Africa | 94.7 /100 | #119 | Exceptional 22.4% |
| Immigrants | Kazakhstan | 93.9 /100 | #120 | Exceptional 22.4% |
| Czechs | 93.5 /100 | #121 | Exceptional 22.4% |
| Immigrants | Jordan | 93.5 /100 | #122 | Exceptional 22.4% |
Demographics Similar to Immigrants from Western Africa by Disability Age 65 to 74
In terms of disability age 65 to 74, the demographic groups most similar to Immigrants from Western Africa are Spaniard (24.6%, a difference of 0.080%), Immigrants from Senegal (24.6%, a difference of 0.080%), Spanish (24.6%, a difference of 0.090%), Immigrants from Caribbean (24.6%, a difference of 0.17%), and Armenian (24.7%, a difference of 0.22%).
| Demographics | Rating | Rank | Disability Age 65 to 74 |
| Panamanians | 4.2 /100 | #234 | Tragic 24.4% |
| Scotch-Irish | 3.8 /100 | #235 | Tragic 24.4% |
| German Russians | 3.7 /100 | #236 | Tragic 24.4% |
| West Indians | 3.4 /100 | #237 | Tragic 24.5% |
| Immigrants | Ghana | 3.0 /100 | #238 | Tragic 24.5% |
| Immigrants | Caribbean | 2.6 /100 | #239 | Tragic 24.6% |
| Spaniards | 2.4 /100 | #240 | Tragic 24.6% |
| Immigrants | Western Africa | 2.3 /100 | #241 | Tragic 24.6% |
| Immigrants | Senegal | 2.2 /100 | #242 | Tragic 24.6% |
| Spanish | 2.2 /100 | #243 | Tragic 24.6% |
| Armenians | 2.0 /100 | #244 | Tragic 24.7% |
| British West Indians | 2.0 /100 | #245 | Tragic 24.7% |
| Immigrants | Iraq | 1.9 /100 | #246 | Tragic 24.7% |
| Indonesians | 1.1 /100 | #247 | Tragic 24.9% |
| Senegalese | 0.9 /100 | #248 | Tragic 24.9% |