Korean vs Immigrants from Cuba Ambulatory Disability
COMPARE
Korean
Immigrants from Cuba
Ambulatory Disability
Ambulatory Disability Comparison
Koreans
Immigrants from Cuba
5.9%
AMBULATORY DISABILITY
91.6/ 100
METRIC RATING
125th/ 347
METRIC RANK
6.5%
AMBULATORY DISABILITY
1.4/ 100
METRIC RATING
247th/ 347
METRIC RANK
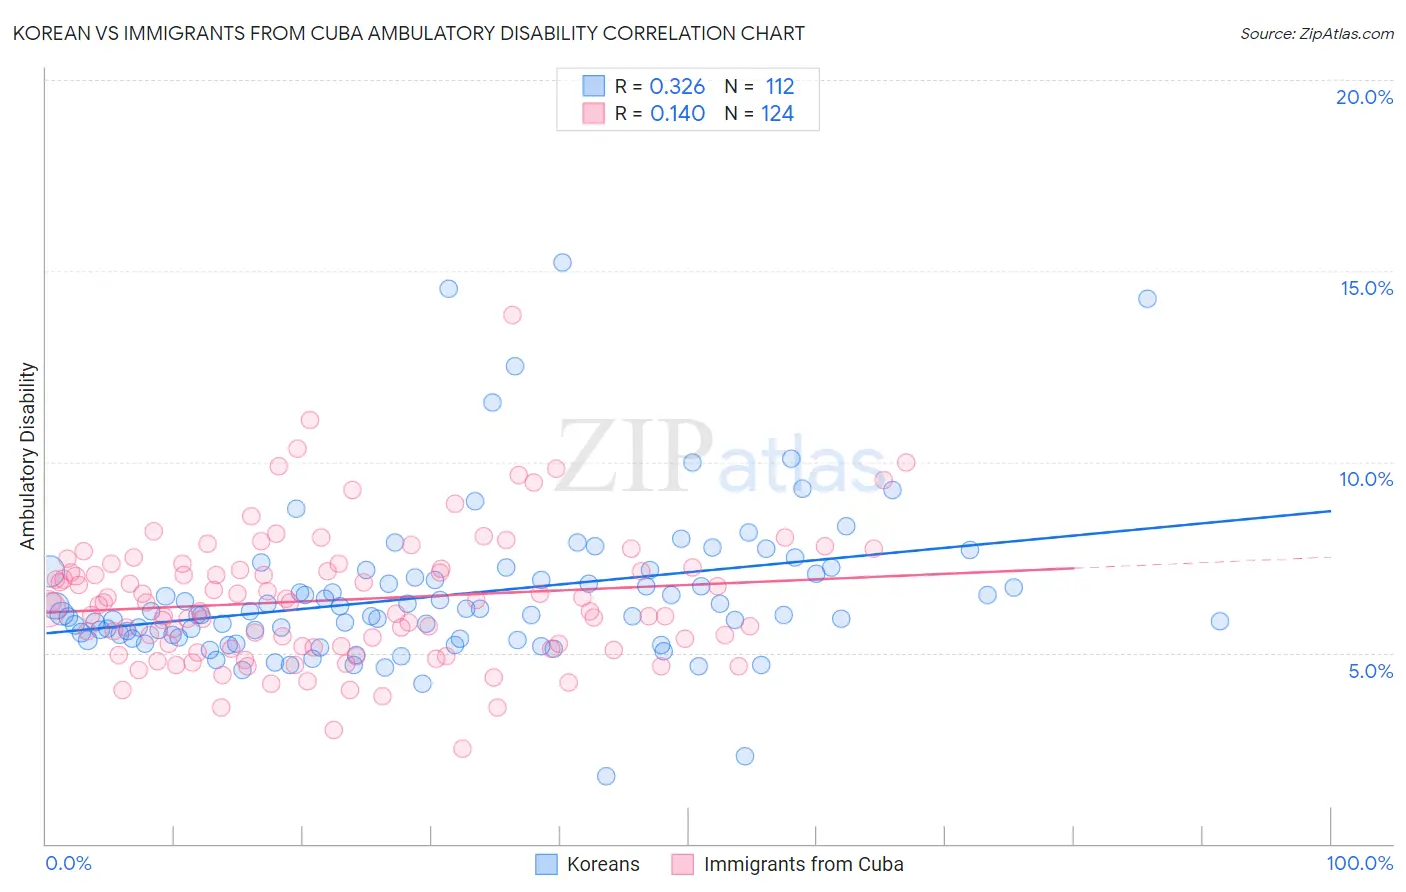
Korean vs Immigrants from Cuba Ambulatory Disability Correlation Chart
The statistical analysis conducted on geographies consisting of 510,581,293 people shows a mild positive correlation between the proportion of Koreans and percentage of population with ambulatory disability in the United States with a correlation coefficient (R) of 0.326 and weighted average of 5.9%. Similarly, the statistical analysis conducted on geographies consisting of 325,985,542 people shows a poor positive correlation between the proportion of Immigrants from Cuba and percentage of population with ambulatory disability in the United States with a correlation coefficient (R) of 0.140 and weighted average of 6.5%, a difference of 9.1%.
Ambulatory Disability Correlation Summary
| Measurement | Korean | Immigrants from Cuba |
| Minimum | 1.8% | 2.5% |
| Maximum | 15.2% | 13.8% |
| Range | 13.4% | 11.4% |
| Mean | 6.5% | 6.4% |
| Median | 6.0% | 6.3% |
| Interquartile 25% (IQ1) | 5.4% | 5.2% |
| Interquartile 75% (IQ3) | 7.0% | 7.2% |
| Interquartile Range (IQR) | 1.6% | 2.1% |
| Standard Deviation (Sample) | 2.0% | 1.7% |
| Standard Deviation (Population) | 2.0% | 1.7% |
Similar Demographics by Ambulatory Disability
Demographics Similar to Koreans by Ambulatory Disability
In terms of ambulatory disability, the demographic groups most similar to Koreans are Arab (5.9%, a difference of 0.020%), Immigrants from Nigeria (5.9%, a difference of 0.11%), Immigrants from Middle Africa (5.9%, a difference of 0.12%), Immigrants from Western Asia (5.9%, a difference of 0.15%), and Immigrants from Russia (5.9%, a difference of 0.16%).
| Demographics | Rating | Rank | Ambulatory Disability |
| Russians | 93.4 /100 | #118 | Exceptional 5.9% |
| Norwegians | 93.1 /100 | #119 | Exceptional 5.9% |
| Estonians | 92.9 /100 | #120 | Exceptional 5.9% |
| Costa Ricans | 92.6 /100 | #121 | Exceptional 5.9% |
| Icelanders | 92.6 /100 | #122 | Exceptional 5.9% |
| Immigrants | Russia | 92.4 /100 | #123 | Exceptional 5.9% |
| Immigrants | Middle Africa | 92.2 /100 | #124 | Exceptional 5.9% |
| Koreans | 91.6 /100 | #125 | Exceptional 5.9% |
| Arabs | 91.5 /100 | #126 | Exceptional 5.9% |
| Immigrants | Nigeria | 90.9 /100 | #127 | Exceptional 5.9% |
| Immigrants | Western Asia | 90.7 /100 | #128 | Exceptional 5.9% |
| Immigrants | Norway | 90.5 /100 | #129 | Exceptional 5.9% |
| Immigrants | Kazakhstan | 89.7 /100 | #130 | Excellent 5.9% |
| Immigrants | Costa Rica | 89.5 /100 | #131 | Excellent 5.9% |
| Immigrants | Europe | 87.8 /100 | #132 | Excellent 6.0% |
Demographics Similar to Immigrants from Cuba by Ambulatory Disability
In terms of ambulatory disability, the demographic groups most similar to Immigrants from Cuba are Immigrants from Portugal (6.5%, a difference of 0.020%), Armenian (6.5%, a difference of 0.050%), Tlingit-Haida (6.5%, a difference of 0.070%), German (6.5%, a difference of 0.10%), and Immigrants from Panama (6.5%, a difference of 0.10%).
| Demographics | Rating | Rank | Ambulatory Disability |
| Immigrants | Senegal | 1.7 /100 | #240 | Tragic 6.4% |
| Immigrants | Haiti | 1.6 /100 | #241 | Tragic 6.5% |
| Spaniards | 1.6 /100 | #242 | Tragic 6.5% |
| Germans | 1.5 /100 | #243 | Tragic 6.5% |
| Immigrants | Panama | 1.5 /100 | #244 | Tragic 6.5% |
| Tlingit-Haida | 1.5 /100 | #245 | Tragic 6.5% |
| Armenians | 1.5 /100 | #246 | Tragic 6.5% |
| Immigrants | Cuba | 1.4 /100 | #247 | Tragic 6.5% |
| Immigrants | Portugal | 1.4 /100 | #248 | Tragic 6.5% |
| Native Hawaiians | 1.1 /100 | #249 | Tragic 6.5% |
| Chinese | 1.0 /100 | #250 | Tragic 6.5% |
| Hawaiians | 0.9 /100 | #251 | Tragic 6.5% |
| Immigrants | Bahamas | 0.8 /100 | #252 | Tragic 6.5% |
| Scottish | 0.7 /100 | #253 | Tragic 6.5% |
| Belizeans | 0.7 /100 | #254 | Tragic 6.5% |