Kiowa vs Immigrants from Latin America Cognitive Disability
COMPARE
Kiowa
Immigrants from Latin America
Cognitive Disability
Cognitive Disability Comparison
Kiowa
Immigrants from Latin America
18.7%
COGNITIVE DISABILITY
0.0/ 100
METRIC RATING
328th/ 347
METRIC RANK
17.6%
COGNITIVE DISABILITY
9.7/ 100
METRIC RATING
207th/ 347
METRIC RANK
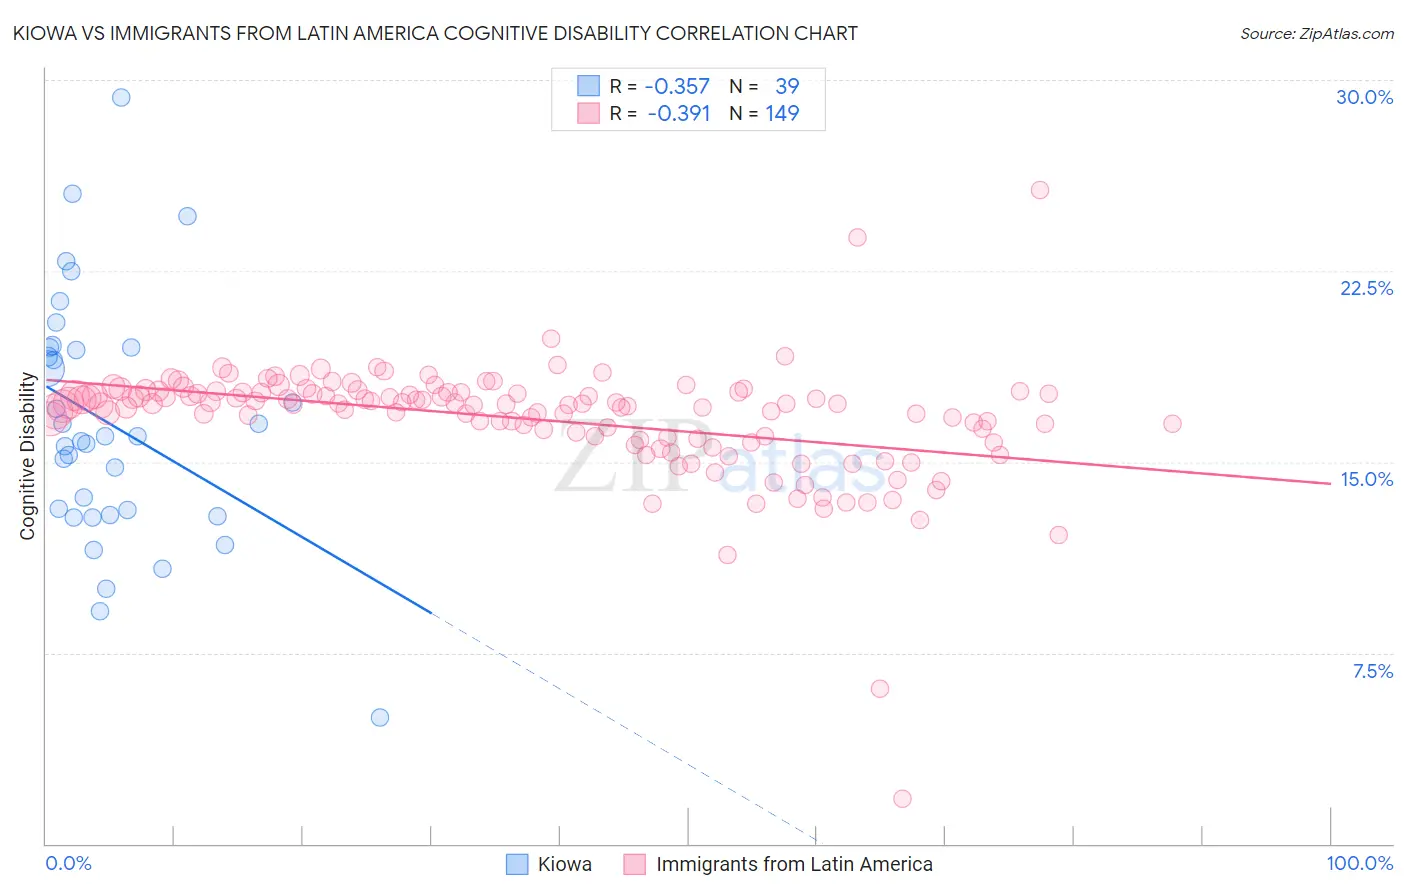
Kiowa vs Immigrants from Latin America Cognitive Disability Correlation Chart
The statistical analysis conducted on geographies consisting of 56,098,824 people shows a mild negative correlation between the proportion of Kiowa and percentage of population with cognitive disability in the United States with a correlation coefficient (R) of -0.357 and weighted average of 18.7%. Similarly, the statistical analysis conducted on geographies consisting of 558,464,403 people shows a mild negative correlation between the proportion of Immigrants from Latin America and percentage of population with cognitive disability in the United States with a correlation coefficient (R) of -0.391 and weighted average of 17.6%, a difference of 6.6%.
Cognitive Disability Correlation Summary
| Measurement | Kiowa | Immigrants from Latin America |
| Minimum | 4.9% | 1.8% |
| Maximum | 29.3% | 25.7% |
| Range | 24.4% | 23.9% |
| Mean | 16.5% | 16.7% |
| Median | 16.0% | 17.3% |
| Interquartile 25% (IQ1) | 12.9% | 16.0% |
| Interquartile 75% (IQ3) | 19.5% | 17.7% |
| Interquartile Range (IQR) | 6.6% | 1.7% |
| Standard Deviation (Sample) | 4.8% | 2.3% |
| Standard Deviation (Population) | 4.8% | 2.3% |
Similar Demographics by Cognitive Disability
Demographics Similar to Kiowa by Cognitive Disability
In terms of cognitive disability, the demographic groups most similar to Kiowa are U.S. Virgin Islander (18.7%, a difference of 0.060%), Immigrants from Senegal (18.7%, a difference of 0.10%), Indonesian (18.7%, a difference of 0.12%), Dominican (18.7%, a difference of 0.20%), and Navajo (18.8%, a difference of 0.22%).
| Demographics | Rating | Rank | Cognitive Disability |
| Africans | 0.0 /100 | #321 | Tragic 18.6% |
| Immigrants | Liberia | 0.0 /100 | #322 | Tragic 18.7% |
| Pueblo | 0.0 /100 | #323 | Tragic 18.7% |
| Dominicans | 0.0 /100 | #324 | Tragic 18.7% |
| Indonesians | 0.0 /100 | #325 | Tragic 18.7% |
| Immigrants | Senegal | 0.0 /100 | #326 | Tragic 18.7% |
| U.S. Virgin Islanders | 0.0 /100 | #327 | Tragic 18.7% |
| Kiowa | 0.0 /100 | #328 | Tragic 18.7% |
| Navajo | 0.0 /100 | #329 | Tragic 18.8% |
| Immigrants | Dominican Republic | 0.0 /100 | #330 | Tragic 18.8% |
| Pima | 0.0 /100 | #331 | Tragic 18.8% |
| Immigrants | Sudan | 0.0 /100 | #332 | Tragic 18.8% |
| Immigrants | Yemen | 0.0 /100 | #333 | Tragic 18.8% |
| Sudanese | 0.0 /100 | #334 | Tragic 18.9% |
| Senegalese | 0.0 /100 | #335 | Tragic 19.0% |
Demographics Similar to Immigrants from Latin America by Cognitive Disability
In terms of cognitive disability, the demographic groups most similar to Immigrants from Latin America are Immigrants from Cameroon (17.6%, a difference of 0.030%), Alaska Native (17.5%, a difference of 0.050%), Immigrants from Trinidad and Tobago (17.6%, a difference of 0.080%), Puget Sound Salish (17.5%, a difference of 0.090%), and Immigrants from Caribbean (17.5%, a difference of 0.10%).
| Demographics | Rating | Rank | Cognitive Disability |
| Haitians | 14.1 /100 | #200 | Poor 17.5% |
| South American Indians | 13.0 /100 | #201 | Poor 17.5% |
| Immigrants | Morocco | 12.0 /100 | #202 | Poor 17.5% |
| Immigrants | Caribbean | 11.0 /100 | #203 | Poor 17.5% |
| Immigrants | Zimbabwe | 11.0 /100 | #204 | Poor 17.5% |
| Puget Sound Salish | 10.9 /100 | #205 | Poor 17.5% |
| Alaska Natives | 10.4 /100 | #206 | Poor 17.5% |
| Immigrants | Latin America | 9.7 /100 | #207 | Tragic 17.6% |
| Immigrants | Cameroon | 9.3 /100 | #208 | Tragic 17.6% |
| Immigrants | Trinidad and Tobago | 8.7 /100 | #209 | Tragic 17.6% |
| Immigrants | Jamaica | 8.5 /100 | #210 | Tragic 17.6% |
| Taiwanese | 7.7 /100 | #211 | Tragic 17.6% |
| Immigrants | Oceania | 7.3 /100 | #212 | Tragic 17.6% |
| Hawaiians | 7.2 /100 | #213 | Tragic 17.6% |
| Immigrants | El Salvador | 7.0 /100 | #214 | Tragic 17.6% |