Jordanian vs Immigrants from Syria Disability Age 65 to 74
COMPARE
Jordanian
Immigrants from Syria
Disability Age 65 to 74
Disability Age 65 to 74 Comparison
Jordanians
Immigrants from Syria
22.2%
DISABILITY AGE 65 TO 74
96.9/ 100
METRIC RATING
98th/ 347
METRIC RANK
22.7%
DISABILITY AGE 65 TO 74
85.8/ 100
METRIC RATING
139th/ 347
METRIC RANK
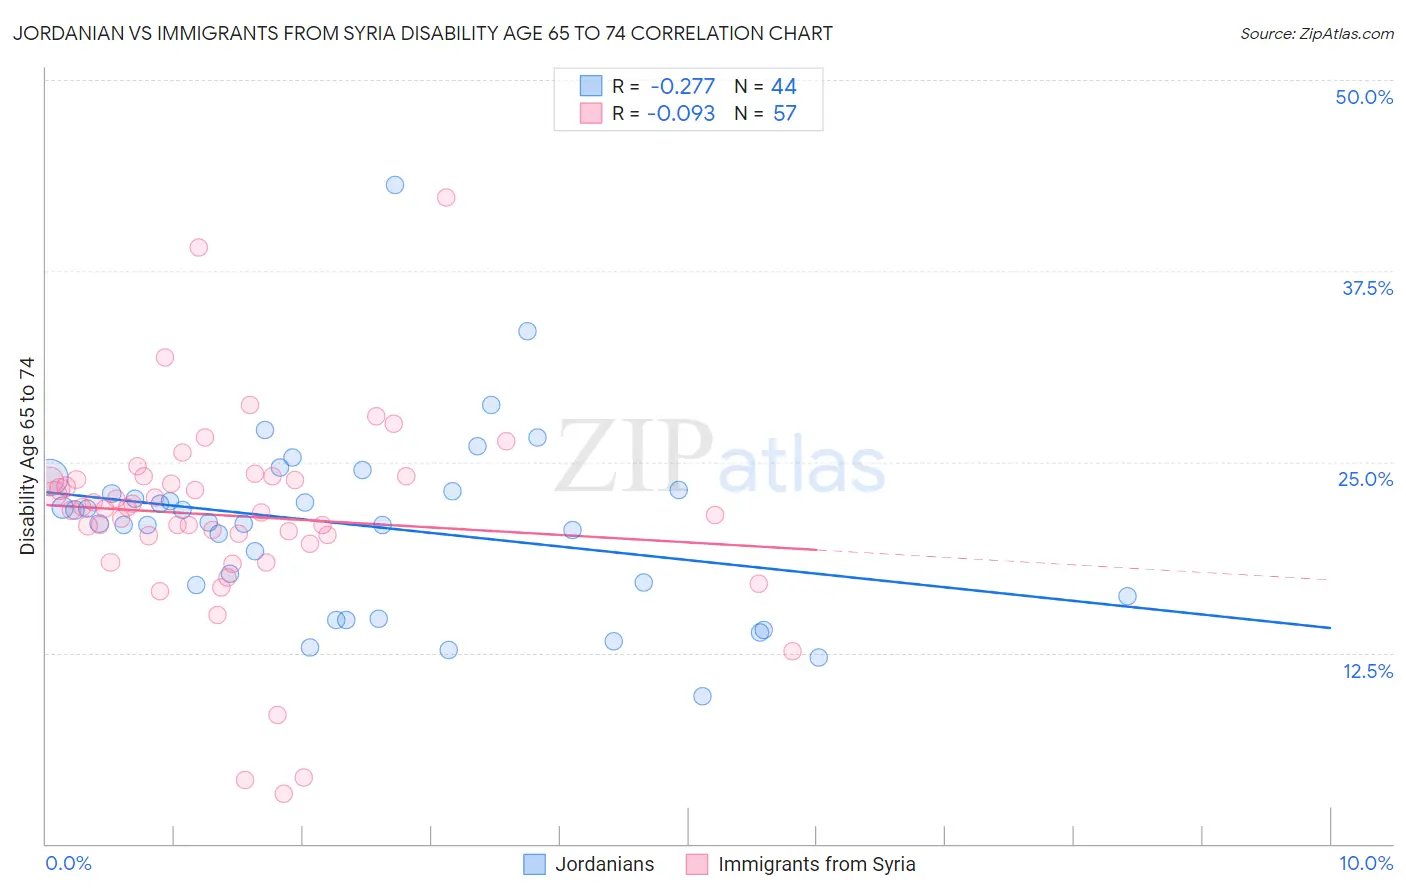
Jordanian vs Immigrants from Syria Disability Age 65 to 74 Correlation Chart
The statistical analysis conducted on geographies consisting of 166,340,353 people shows a weak negative correlation between the proportion of Jordanians and percentage of population with a disability between the ages 65 and 75 in the United States with a correlation coefficient (R) of -0.277 and weighted average of 22.2%. Similarly, the statistical analysis conducted on geographies consisting of 174,093,430 people shows a slight negative correlation between the proportion of Immigrants from Syria and percentage of population with a disability between the ages 65 and 75 in the United States with a correlation coefficient (R) of -0.093 and weighted average of 22.7%, a difference of 2.5%.
Disability Age 65 to 74 Correlation Summary
| Measurement | Jordanian | Immigrants from Syria |
| Minimum | 9.7% | 3.3% |
| Maximum | 43.1% | 42.3% |
| Range | 33.4% | 39.0% |
| Mean | 20.8% | 21.5% |
| Median | 21.0% | 21.9% |
| Interquartile 25% (IQ1) | 16.6% | 19.9% |
| Interquartile 75% (IQ3) | 23.1% | 23.9% |
| Interquartile Range (IQR) | 6.5% | 4.0% |
| Standard Deviation (Sample) | 6.0% | 6.6% |
| Standard Deviation (Population) | 6.0% | 6.6% |
Similar Demographics by Disability Age 65 to 74
Demographics Similar to Jordanians by Disability Age 65 to 74
In terms of disability age 65 to 74, the demographic groups most similar to Jordanians are Immigrants from Colombia (22.2%, a difference of 0.030%), Uruguayan (22.2%, a difference of 0.16%), Immigrants from England (22.2%, a difference of 0.17%), Immigrants from Saudi Arabia (22.2%, a difference of 0.20%), and Immigrants from Southern Europe (22.1%, a difference of 0.21%).
| Demographics | Rating | Rank | Disability Age 65 to 74 |
| Chileans | 97.9 /100 | #91 | Exceptional 22.0% |
| Poles | 97.8 /100 | #92 | Exceptional 22.0% |
| Immigrants | Canada | 97.8 /100 | #93 | Exceptional 22.1% |
| Immigrants | Chile | 97.7 /100 | #94 | Exceptional 22.1% |
| Romanians | 97.7 /100 | #95 | Exceptional 22.1% |
| Immigrants | North America | 97.5 /100 | #96 | Exceptional 22.1% |
| Immigrants | Southern Europe | 97.2 /100 | #97 | Exceptional 22.1% |
| Jordanians | 96.9 /100 | #98 | Exceptional 22.2% |
| Immigrants | Colombia | 96.8 /100 | #99 | Exceptional 22.2% |
| Uruguayans | 96.5 /100 | #100 | Exceptional 22.2% |
| Immigrants | England | 96.5 /100 | #101 | Exceptional 22.2% |
| Immigrants | Saudi Arabia | 96.4 /100 | #102 | Exceptional 22.2% |
| South Americans | 96.4 /100 | #103 | Exceptional 22.2% |
| Colombians | 96.4 /100 | #104 | Exceptional 22.2% |
| Palestinians | 96.3 /100 | #105 | Exceptional 22.2% |
Demographics Similar to Immigrants from Syria by Disability Age 65 to 74
In terms of disability age 65 to 74, the demographic groups most similar to Immigrants from Syria are Ugandan (22.7%, a difference of 0.040%), Belgian (22.7%, a difference of 0.050%), Immigrants from Ethiopia (22.7%, a difference of 0.060%), Arab (22.8%, a difference of 0.12%), and Danish (22.8%, a difference of 0.17%).
| Demographics | Rating | Rank | Disability Age 65 to 74 |
| Costa Ricans | 89.2 /100 | #132 | Excellent 22.6% |
| Northern Europeans | 88.9 /100 | #133 | Excellent 22.6% |
| Afghans | 88.6 /100 | #134 | Excellent 22.6% |
| Immigrants | Ukraine | 88.4 /100 | #135 | Excellent 22.6% |
| Ethiopians | 87.9 /100 | #136 | Excellent 22.7% |
| Taiwanese | 87.6 /100 | #137 | Excellent 22.7% |
| Immigrants | Moldova | 87.3 /100 | #138 | Excellent 22.7% |
| Immigrants | Syria | 85.8 /100 | #139 | Excellent 22.7% |
| Ugandans | 85.4 /100 | #140 | Excellent 22.7% |
| Belgians | 85.3 /100 | #141 | Excellent 22.7% |
| Immigrants | Ethiopia | 85.3 /100 | #142 | Excellent 22.7% |
| Arabs | 84.8 /100 | #143 | Excellent 22.8% |
| Danes | 84.4 /100 | #144 | Excellent 22.8% |
| Immigrants | Uganda | 84.0 /100 | #145 | Excellent 22.8% |
| Alsatians | 83.7 /100 | #146 | Excellent 22.8% |