Jordanian vs Immigrants from Kazakhstan Male Disability
COMPARE
Jordanian
Immigrants from Kazakhstan
Male Disability
Male Disability Comparison
Jordanians
Immigrants from Kazakhstan
10.5%
MALE DISABILITY
99.3/ 100
METRIC RATING
64th/ 347
METRIC RANK
10.7%
MALE DISABILITY
95.9/ 100
METRIC RATING
100th/ 347
METRIC RANK
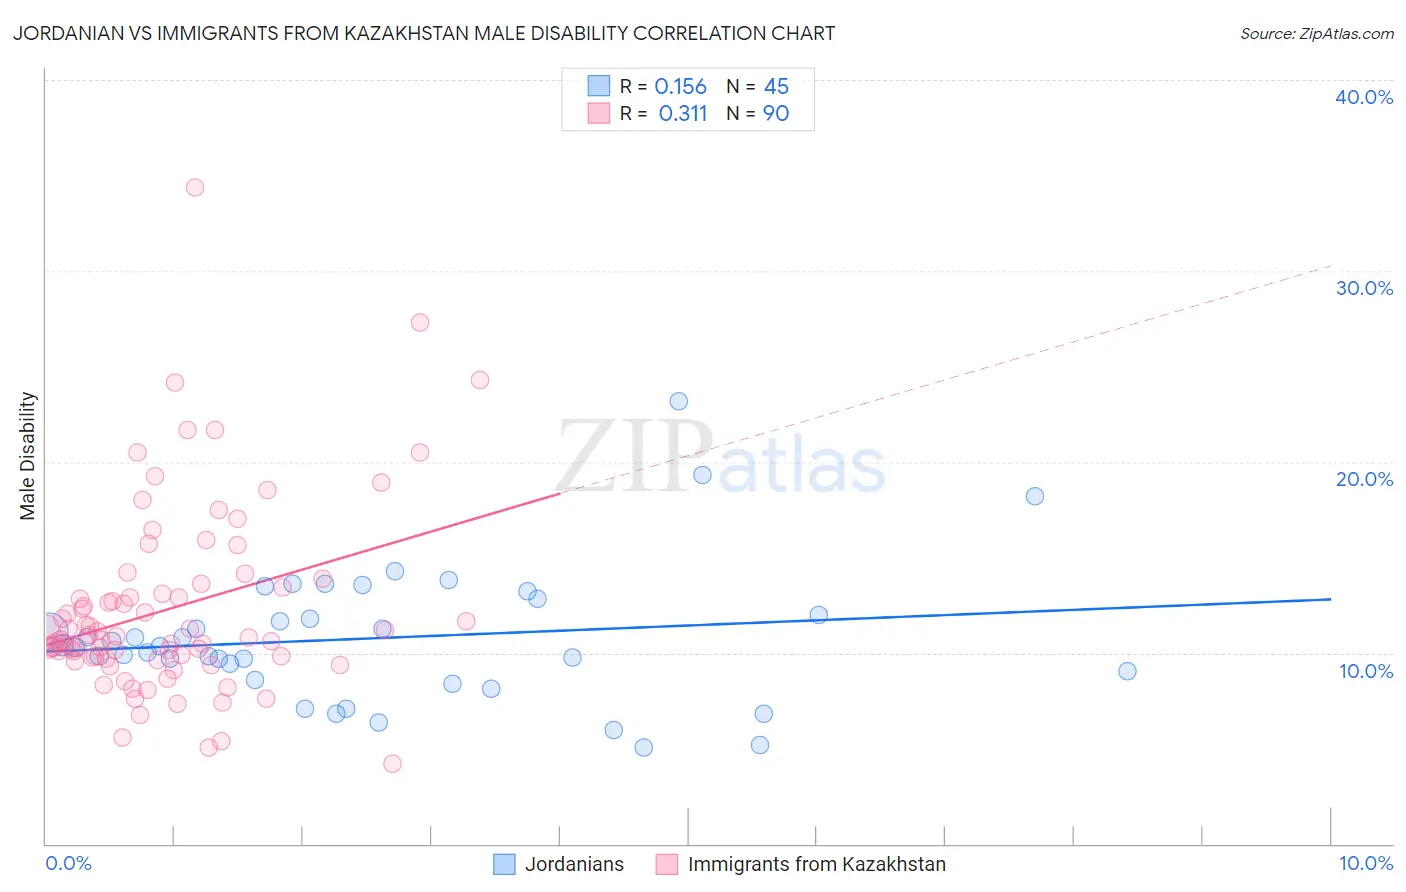
Jordanian vs Immigrants from Kazakhstan Male Disability Correlation Chart
The statistical analysis conducted on geographies consisting of 166,415,761 people shows a poor positive correlation between the proportion of Jordanians and percentage of males with a disability in the United States with a correlation coefficient (R) of 0.156 and weighted average of 10.5%. Similarly, the statistical analysis conducted on geographies consisting of 124,443,289 people shows a mild positive correlation between the proportion of Immigrants from Kazakhstan and percentage of males with a disability in the United States with a correlation coefficient (R) of 0.311 and weighted average of 10.7%, a difference of 2.6%.
Male Disability Correlation Summary
| Measurement | Jordanian | Immigrants from Kazakhstan |
| Minimum | 5.0% | 4.2% |
| Maximum | 23.2% | 34.4% |
| Range | 18.1% | 30.2% |
| Mean | 10.8% | 12.3% |
| Median | 10.4% | 10.8% |
| Interquartile 25% (IQ1) | 8.8% | 9.8% |
| Interquartile 75% (IQ3) | 12.4% | 13.4% |
| Interquartile Range (IQR) | 3.6% | 3.6% |
| Standard Deviation (Sample) | 3.5% | 5.0% |
| Standard Deviation (Population) | 3.5% | 4.9% |
Similar Demographics by Male Disability
Demographics Similar to Jordanians by Male Disability
In terms of male disability, the demographic groups most similar to Jordanians are Immigrants from Grenada (10.5%, a difference of 0.020%), Guyanese (10.5%, a difference of 0.030%), Immigrants from Afghanistan (10.5%, a difference of 0.030%), Immigrants from Belarus (10.4%, a difference of 0.12%), and Colombian (10.5%, a difference of 0.13%).
| Demographics | Rating | Rank | Male Disability |
| Immigrants | South America | 99.6 /100 | #57 | Exceptional 10.4% |
| Immigrants | Japan | 99.5 /100 | #58 | Exceptional 10.4% |
| Immigrants | Australia | 99.5 /100 | #59 | Exceptional 10.4% |
| Immigrants | Colombia | 99.5 /100 | #60 | Exceptional 10.4% |
| Immigrants | Northern Africa | 99.4 /100 | #61 | Exceptional 10.4% |
| Immigrants | Ecuador | 99.3 /100 | #62 | Exceptional 10.4% |
| Immigrants | Belarus | 99.3 /100 | #63 | Exceptional 10.4% |
| Jordanians | 99.3 /100 | #64 | Exceptional 10.5% |
| Immigrants | Grenada | 99.2 /100 | #65 | Exceptional 10.5% |
| Guyanese | 99.2 /100 | #66 | Exceptional 10.5% |
| Immigrants | Afghanistan | 99.2 /100 | #67 | Exceptional 10.5% |
| Colombians | 99.2 /100 | #68 | Exceptional 10.5% |
| Ecuadorians | 99.2 /100 | #69 | Exceptional 10.5% |
| Immigrants | Bulgaria | 99.1 /100 | #70 | Exceptional 10.5% |
| Immigrants | Cameroon | 99.0 /100 | #71 | Exceptional 10.5% |
Demographics Similar to Immigrants from Kazakhstan by Male Disability
In terms of male disability, the demographic groups most similar to Immigrants from Kazakhstan are Immigrants from Switzerland (10.7%, a difference of 0.070%), Immigrants from Greece (10.7%, a difference of 0.11%), Immigrants from Romania (10.7%, a difference of 0.21%), Immigrants from Eastern Europe (10.7%, a difference of 0.21%), and Uruguayan (10.7%, a difference of 0.22%).
| Demographics | Rating | Rank | Male Disability |
| Immigrants | St. Vincent and the Grenadines | 97.1 /100 | #93 | Exceptional 10.7% |
| Immigrants | Sweden | 96.9 /100 | #94 | Exceptional 10.7% |
| Chileans | 96.9 /100 | #95 | Exceptional 10.7% |
| Nicaraguans | 96.6 /100 | #96 | Exceptional 10.7% |
| Immigrants | Armenia | 96.6 /100 | #97 | Exceptional 10.7% |
| Immigrants | Romania | 96.5 /100 | #98 | Exceptional 10.7% |
| Immigrants | Switzerland | 96.1 /100 | #99 | Exceptional 10.7% |
| Immigrants | Kazakhstan | 95.9 /100 | #100 | Exceptional 10.7% |
| Immigrants | Greece | 95.6 /100 | #101 | Exceptional 10.7% |
| Immigrants | Eastern Europe | 95.3 /100 | #102 | Exceptional 10.7% |
| Uruguayans | 95.3 /100 | #103 | Exceptional 10.7% |
| Immigrants | Nigeria | 95.1 /100 | #104 | Exceptional 10.8% |
| Immigrants | Brazil | 95.0 /100 | #105 | Exceptional 10.8% |
| Immigrants | Syria | 94.9 /100 | #106 | Exceptional 10.8% |
| Immigrants | Eastern Africa | 94.3 /100 | #107 | Exceptional 10.8% |