Jordanian vs Immigrants from Eritrea Vision Disability
COMPARE
Jordanian
Immigrants from Eritrea
Vision Disability
Vision Disability Comparison
Jordanians
Immigrants from Eritrea
2.0%
VISION DISABILITY
99.2/ 100
METRIC RATING
56th/ 347
METRIC RANK
2.0%
VISION DISABILITY
98.4/ 100
METRIC RATING
73rd/ 347
METRIC RANK
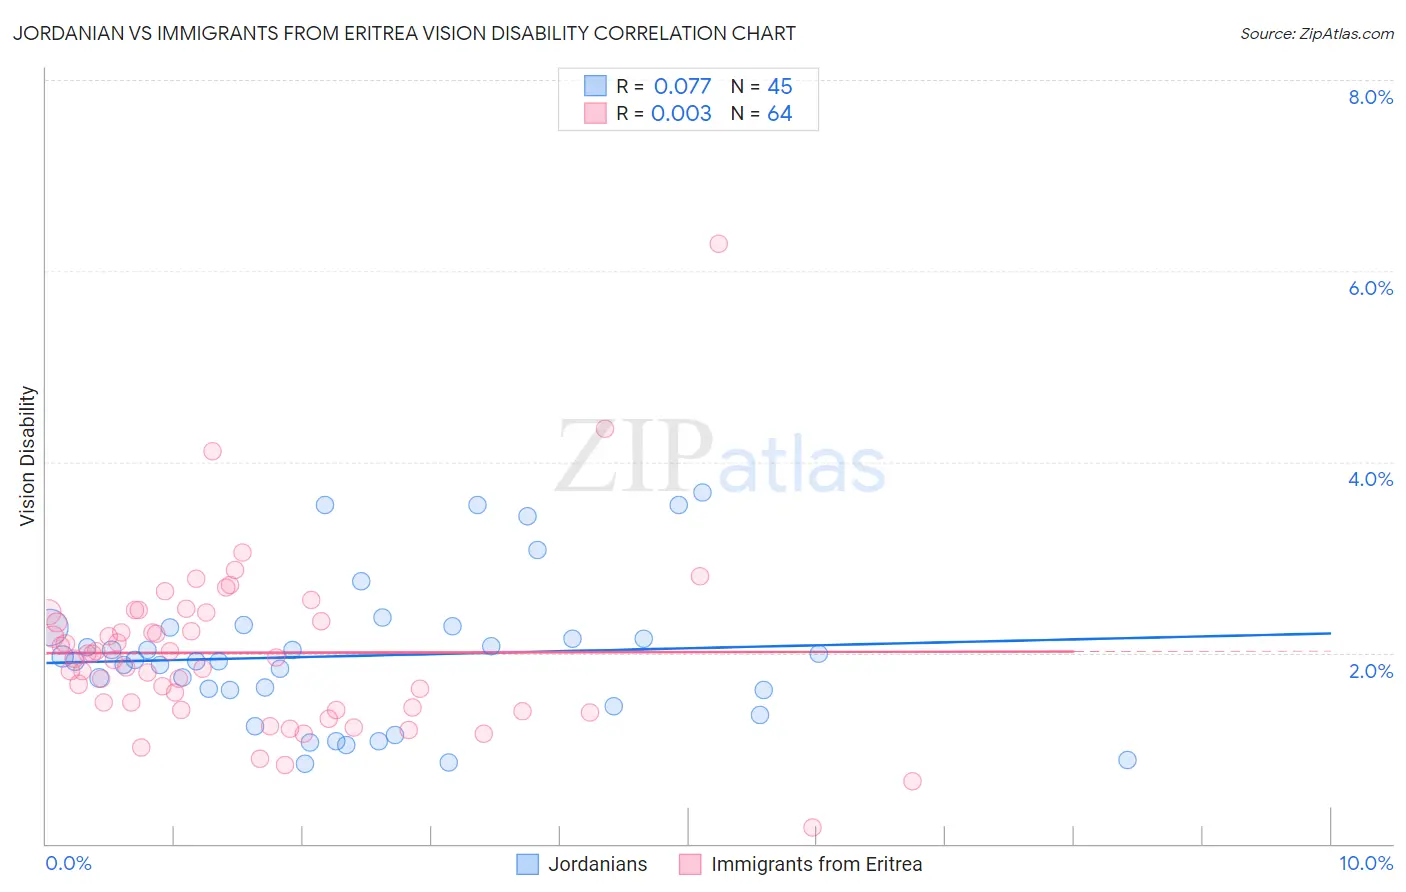
Jordanian vs Immigrants from Eritrea Vision Disability Correlation Chart
The statistical analysis conducted on geographies consisting of 166,387,634 people shows a slight positive correlation between the proportion of Jordanians and percentage of population with vision disability in the United States with a correlation coefficient (R) of 0.077 and weighted average of 2.0%. Similarly, the statistical analysis conducted on geographies consisting of 104,851,748 people shows no correlation between the proportion of Immigrants from Eritrea and percentage of population with vision disability in the United States with a correlation coefficient (R) of 0.003 and weighted average of 2.0%, a difference of 1.3%.
Vision Disability Correlation Summary
| Measurement | Jordanian | Immigrants from Eritrea |
| Minimum | 0.83% | 0.17% |
| Maximum | 3.7% | 6.3% |
| Range | 2.8% | 6.1% |
| Mean | 2.0% | 2.0% |
| Median | 1.9% | 1.9% |
| Interquartile 25% (IQ1) | 1.5% | 1.4% |
| Interquartile 75% (IQ3) | 2.3% | 2.4% |
| Interquartile Range (IQR) | 0.74% | 0.96% |
| Standard Deviation (Sample) | 0.75% | 0.90% |
| Standard Deviation (Population) | 0.74% | 0.89% |
Demographics Similar to Jordanians and Immigrants from Eritrea by Vision Disability
In terms of vision disability, the demographic groups most similar to Jordanians are Somali (2.0%, a difference of 0.020%), Immigrants from Saudi Arabia (2.0%, a difference of 0.090%), Laotian (2.0%, a difference of 0.17%), Macedonian (2.0%, a difference of 0.22%), and Argentinean (2.0%, a difference of 0.23%). Similarly, the demographic groups most similar to Immigrants from Eritrea are Palestinian (2.0%, a difference of 0.050%), Immigrants from France (2.0%, a difference of 0.20%), Immigrants from Northern Europe (2.0%, a difference of 0.25%), Immigrants from Kazakhstan (2.0%, a difference of 0.26%), and Russian (2.0%, a difference of 0.28%).
| Demographics | Rating | Rank | Vision Disability |
| Macedonians | 99.3 /100 | #54 | Exceptional 2.0% |
| Laotians | 99.3 /100 | #55 | Exceptional 2.0% |
| Jordanians | 99.2 /100 | #56 | Exceptional 2.0% |
| Somalis | 99.2 /100 | #57 | Exceptional 2.0% |
| Immigrants | Saudi Arabia | 99.2 /100 | #58 | Exceptional 2.0% |
| Argentineans | 99.1 /100 | #59 | Exceptional 2.0% |
| Immigrants | Romania | 99.1 /100 | #60 | Exceptional 2.0% |
| Immigrants | Belgium | 99.1 /100 | #61 | Exceptional 2.0% |
| Immigrants | Russia | 99.1 /100 | #62 | Exceptional 2.0% |
| Armenians | 99.0 /100 | #63 | Exceptional 2.0% |
| Immigrants | Greece | 99.0 /100 | #64 | Exceptional 2.0% |
| Maltese | 98.9 /100 | #65 | Exceptional 2.0% |
| Immigrants | Argentina | 98.9 /100 | #66 | Exceptional 2.0% |
| Immigrants | Northern Africa | 98.8 /100 | #67 | Exceptional 2.0% |
| Immigrants | Czechoslovakia | 98.7 /100 | #68 | Exceptional 2.0% |
| Russians | 98.6 /100 | #69 | Exceptional 2.0% |
| Immigrants | Kazakhstan | 98.6 /100 | #70 | Exceptional 2.0% |
| Immigrants | Northern Europe | 98.6 /100 | #71 | Exceptional 2.0% |
| Immigrants | France | 98.5 /100 | #72 | Exceptional 2.0% |
| Immigrants | Eritrea | 98.4 /100 | #73 | Exceptional 2.0% |
| Palestinians | 98.3 /100 | #74 | Exceptional 2.0% |