Italian vs Barbadian Disability Age 65 to 74
COMPARE
Italian
Barbadian
Disability Age 65 to 74
Disability Age 65 to 74 Comparison
Italians
Barbadians
22.0%
DISABILITY AGE 65 TO 74
97.9/ 100
METRIC RATING
90th/ 347
METRIC RANK
24.3%
DISABILITY AGE 65 TO 74
6.0/ 100
METRIC RATING
230th/ 347
METRIC RANK
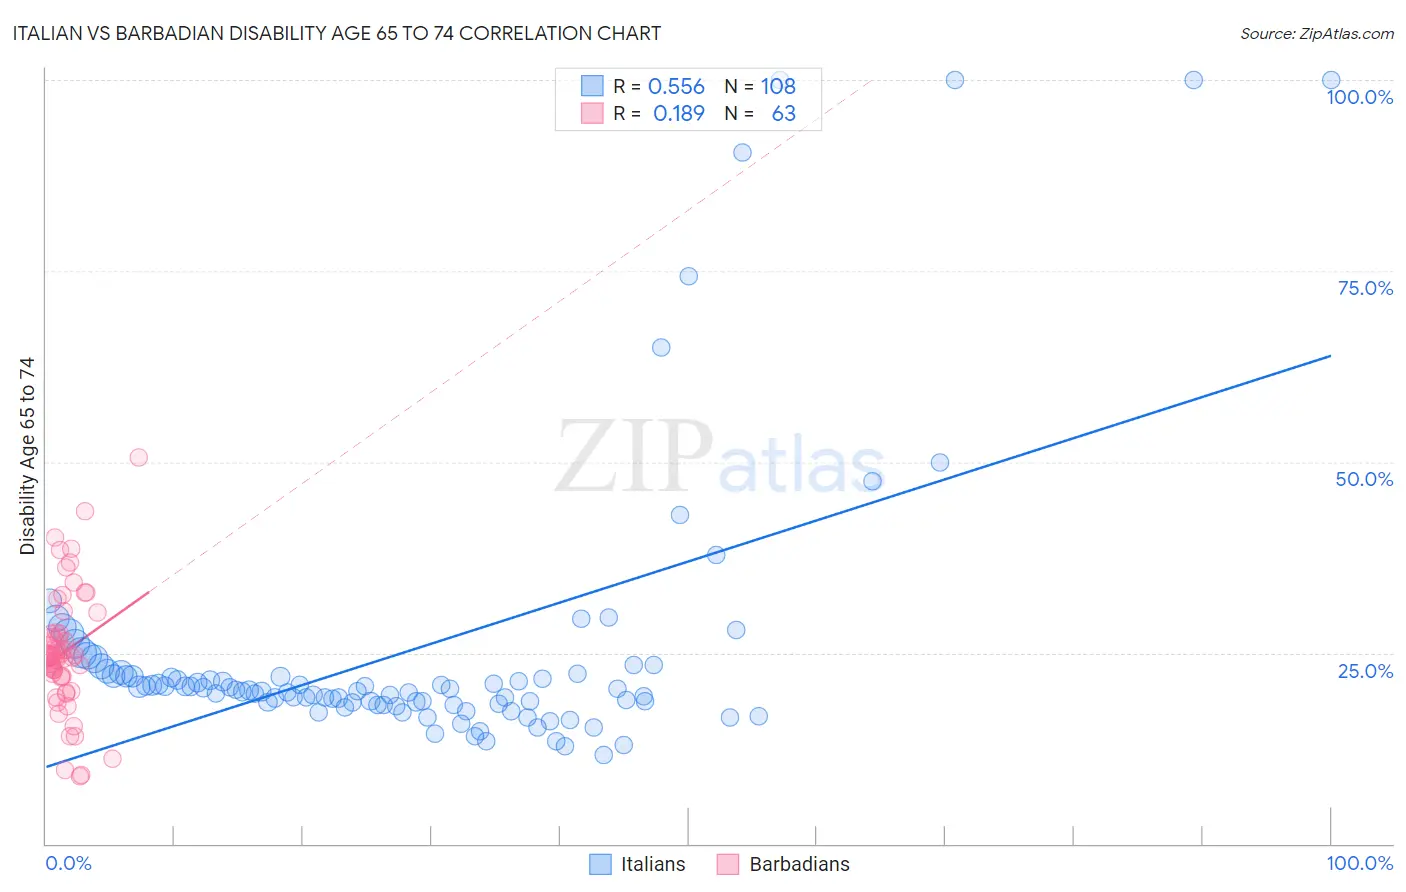
Italian vs Barbadian Disability Age 65 to 74 Correlation Chart
The statistical analysis conducted on geographies consisting of 572,372,600 people shows a substantial positive correlation between the proportion of Italians and percentage of population with a disability between the ages 65 and 75 in the United States with a correlation coefficient (R) of 0.556 and weighted average of 22.0%. Similarly, the statistical analysis conducted on geographies consisting of 141,163,883 people shows a poor positive correlation between the proportion of Barbadians and percentage of population with a disability between the ages 65 and 75 in the United States with a correlation coefficient (R) of 0.189 and weighted average of 24.3%, a difference of 10.2%.
Disability Age 65 to 74 Correlation Summary
| Measurement | Italian | Barbadian |
| Minimum | 11.6% | 8.8% |
| Maximum | 100.0% | 50.6% |
| Range | 88.4% | 41.8% |
| Mean | 25.4% | 25.1% |
| Median | 20.2% | 24.5% |
| Interquartile 25% (IQ1) | 18.3% | 21.9% |
| Interquartile 75% (IQ3) | 22.3% | 27.5% |
| Interquartile Range (IQR) | 4.0% | 5.6% |
| Standard Deviation (Sample) | 18.4% | 7.9% |
| Standard Deviation (Population) | 18.3% | 7.8% |
Similar Demographics by Disability Age 65 to 74
Demographics Similar to Italians by Disability Age 65 to 74
In terms of disability age 65 to 74, the demographic groups most similar to Italians are Immigrants from Kuwait (22.0%, a difference of 0.010%), Immigrants from Netherlands (22.0%, a difference of 0.020%), Chilean (22.0%, a difference of 0.020%), Australian (22.0%, a difference of 0.030%), and Polish (22.0%, a difference of 0.070%).
| Demographics | Rating | Rank | Disability Age 65 to 74 |
| Immigrants | Brazil | 98.5 /100 | #83 | Exceptional 21.9% |
| Immigrants | Spain | 98.5 /100 | #84 | Exceptional 21.9% |
| Immigrants | Lebanon | 98.4 /100 | #85 | Exceptional 21.9% |
| South Africans | 98.4 /100 | #86 | Exceptional 21.9% |
| Australians | 98.0 /100 | #87 | Exceptional 22.0% |
| Immigrants | Netherlands | 97.9 /100 | #88 | Exceptional 22.0% |
| Immigrants | Kuwait | 97.9 /100 | #89 | Exceptional 22.0% |
| Italians | 97.9 /100 | #90 | Exceptional 22.0% |
| Chileans | 97.9 /100 | #91 | Exceptional 22.0% |
| Poles | 97.8 /100 | #92 | Exceptional 22.0% |
| Immigrants | Canada | 97.8 /100 | #93 | Exceptional 22.1% |
| Immigrants | Chile | 97.7 /100 | #94 | Exceptional 22.1% |
| Romanians | 97.7 /100 | #95 | Exceptional 22.1% |
| Immigrants | North America | 97.5 /100 | #96 | Exceptional 22.1% |
| Immigrants | Southern Europe | 97.2 /100 | #97 | Exceptional 22.1% |
Demographics Similar to Barbadians by Disability Age 65 to 74
In terms of disability age 65 to 74, the demographic groups most similar to Barbadians are Celtic (24.2%, a difference of 0.11%), White/Caucasian (24.2%, a difference of 0.16%), Immigrants from Thailand (24.3%, a difference of 0.20%), Immigrants from Zaire (24.3%, a difference of 0.25%), and Nigerian (24.2%, a difference of 0.40%).
| Demographics | Rating | Rank | Disability Age 65 to 74 |
| Immigrants | Middle Africa | 8.9 /100 | #223 | Tragic 24.1% |
| Immigrants | Panama | 8.6 /100 | #224 | Tragic 24.1% |
| Bermudans | 8.2 /100 | #225 | Tragic 24.2% |
| Iraqis | 8.1 /100 | #226 | Tragic 24.2% |
| Nigerians | 7.8 /100 | #227 | Tragic 24.2% |
| Whites/Caucasians | 6.6 /100 | #228 | Tragic 24.2% |
| Celtics | 6.4 /100 | #229 | Tragic 24.2% |
| Barbadians | 6.0 /100 | #230 | Tragic 24.3% |
| Immigrants | Thailand | 5.2 /100 | #231 | Tragic 24.3% |
| Immigrants | Zaire | 5.0 /100 | #232 | Tragic 24.3% |
| Bahamians | 4.5 /100 | #233 | Tragic 24.4% |
| Panamanians | 4.2 /100 | #234 | Tragic 24.4% |
| Scotch-Irish | 3.8 /100 | #235 | Tragic 24.4% |
| German Russians | 3.7 /100 | #236 | Tragic 24.4% |
| West Indians | 3.4 /100 | #237 | Tragic 24.5% |