Iranian vs White/Caucasian Vision Disability
COMPARE
Iranian
White/Caucasian
Vision Disability
Vision Disability Comparison
Iranians
Whites/Caucasians
1.8%
VISION DISABILITY
100.0/ 100
METRIC RATING
8th/ 347
METRIC RANK
2.4%
VISION DISABILITY
0.2/ 100
METRIC RATING
259th/ 347
METRIC RANK
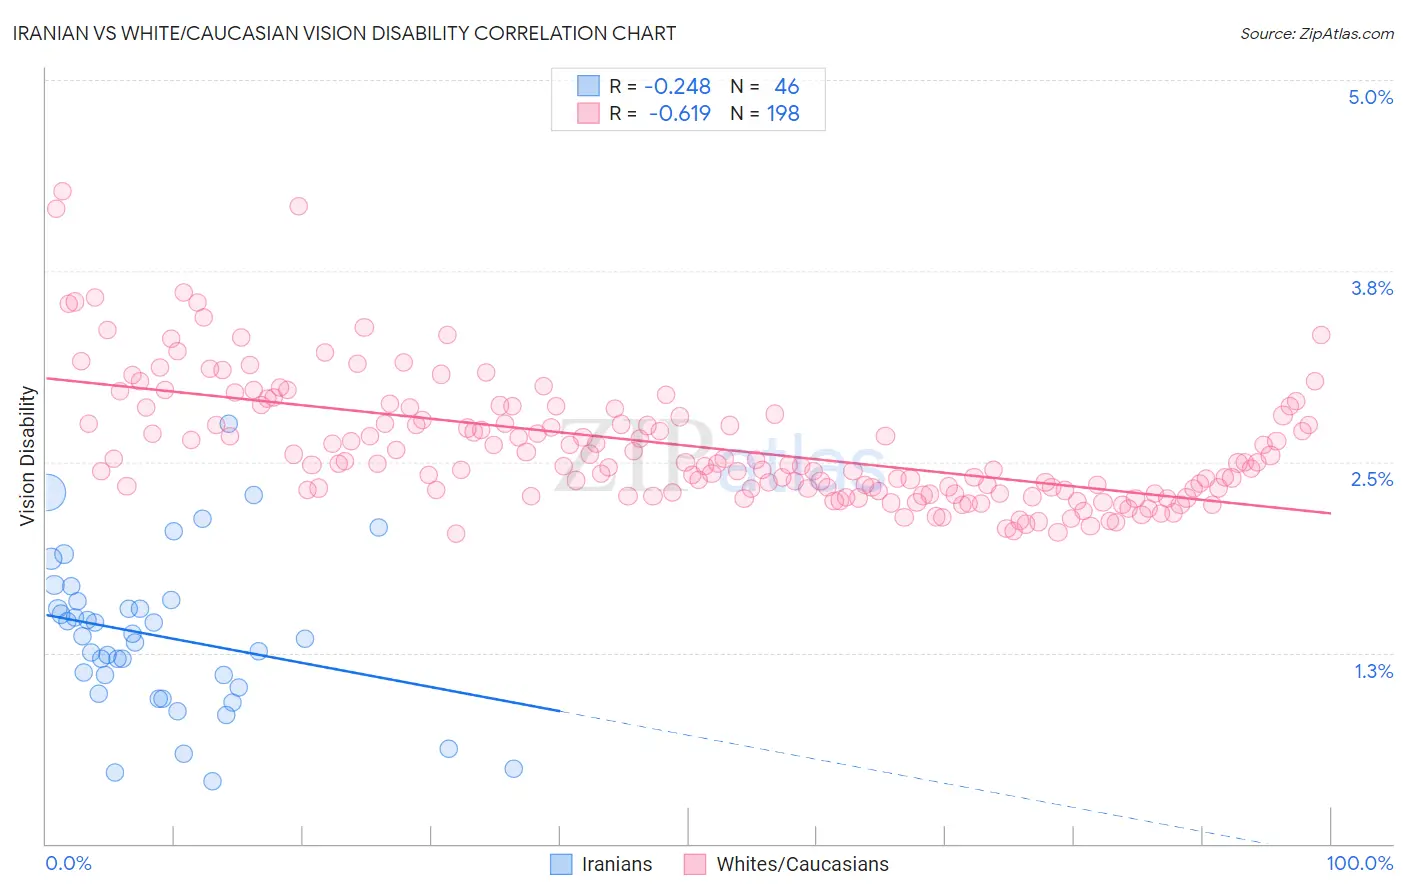
Iranian vs White/Caucasian Vision Disability Correlation Chart
The statistical analysis conducted on geographies consisting of 316,677,046 people shows a weak negative correlation between the proportion of Iranians and percentage of population with vision disability in the United States with a correlation coefficient (R) of -0.248 and weighted average of 1.8%. Similarly, the statistical analysis conducted on geographies consisting of 580,529,348 people shows a significant negative correlation between the proportion of Whites/Caucasians and percentage of population with vision disability in the United States with a correlation coefficient (R) of -0.619 and weighted average of 2.4%, a difference of 33.0%.
Vision Disability Correlation Summary
| Measurement | Iranian | White/Caucasian |
| Minimum | 0.41% | 2.0% |
| Maximum | 2.8% | 4.3% |
| Range | 2.3% | 2.2% |
| Mean | 1.4% | 2.6% |
| Median | 1.4% | 2.5% |
| Interquartile 25% (IQ1) | 1.0% | 2.3% |
| Interquartile 75% (IQ3) | 1.6% | 2.8% |
| Interquartile Range (IQR) | 0.57% | 0.50% |
| Standard Deviation (Sample) | 0.51% | 0.41% |
| Standard Deviation (Population) | 0.50% | 0.41% |
Similar Demographics by Vision Disability
Demographics Similar to Iranians by Vision Disability
In terms of vision disability, the demographic groups most similar to Iranians are Immigrants from South Central Asia (1.8%, a difference of 0.15%), Immigrants from Iran (1.8%, a difference of 0.21%), Immigrants from Singapore (1.8%, a difference of 0.74%), Okinawan (1.8%, a difference of 0.80%), and Immigrants from Hong Kong (1.8%, a difference of 0.93%).
| Demographics | Rating | Rank | Vision Disability |
| Immigrants | India | 100.0 /100 | #1 | Exceptional 1.7% |
| Filipinos | 100.0 /100 | #2 | Exceptional 1.7% |
| Immigrants | Taiwan | 100.0 /100 | #3 | Exceptional 1.7% |
| Thais | 100.0 /100 | #4 | Exceptional 1.7% |
| Okinawans | 100.0 /100 | #5 | Exceptional 1.8% |
| Immigrants | Iran | 100.0 /100 | #6 | Exceptional 1.8% |
| Immigrants | South Central Asia | 100.0 /100 | #7 | Exceptional 1.8% |
| Iranians | 100.0 /100 | #8 | Exceptional 1.8% |
| Immigrants | Singapore | 100.0 /100 | #9 | Exceptional 1.8% |
| Immigrants | Hong Kong | 100.0 /100 | #10 | Exceptional 1.8% |
| Immigrants | Israel | 100.0 /100 | #11 | Exceptional 1.8% |
| Immigrants | Korea | 100.0 /100 | #12 | Exceptional 1.8% |
| Immigrants | Eastern Asia | 100.0 /100 | #13 | Exceptional 1.8% |
| Immigrants | China | 100.0 /100 | #14 | Exceptional 1.8% |
| Immigrants | Bolivia | 100.0 /100 | #15 | Exceptional 1.8% |
Demographics Similar to Whites/Caucasians by Vision Disability
In terms of vision disability, the demographic groups most similar to Whites/Caucasians are British West Indian (2.4%, a difference of 0.010%), West Indian (2.4%, a difference of 0.040%), Immigrants from Haiti (2.4%, a difference of 0.12%), Belizean (2.4%, a difference of 0.17%), and Fijian (2.4%, a difference of 0.38%).
| Demographics | Rating | Rank | Vision Disability |
| Immigrants | Micronesia | 0.3 /100 | #252 | Tragic 2.4% |
| Japanese | 0.3 /100 | #253 | Tragic 2.4% |
| Haitians | 0.3 /100 | #254 | Tragic 2.4% |
| Immigrants | Guatemala | 0.3 /100 | #255 | Tragic 2.4% |
| Immigrants | Haiti | 0.2 /100 | #256 | Tragic 2.4% |
| West Indians | 0.2 /100 | #257 | Tragic 2.4% |
| British West Indians | 0.2 /100 | #258 | Tragic 2.4% |
| Whites/Caucasians | 0.2 /100 | #259 | Tragic 2.4% |
| Belizeans | 0.2 /100 | #260 | Tragic 2.4% |
| Fijians | 0.1 /100 | #261 | Tragic 2.4% |
| Jamaicans | 0.1 /100 | #262 | Tragic 2.4% |
| Immigrants | Belize | 0.1 /100 | #263 | Tragic 2.4% |
| Immigrants | Liberia | 0.1 /100 | #264 | Tragic 2.4% |
| Immigrants | Jamaica | 0.1 /100 | #265 | Tragic 2.4% |
| Mexican American Indians | 0.1 /100 | #266 | Tragic 2.4% |