Iranian vs Immigrants from Ireland Ambulatory Disability
COMPARE
Iranian
Immigrants from Ireland
Ambulatory Disability
Ambulatory Disability Comparison
Iranians
Immigrants from Ireland
5.1%
AMBULATORY DISABILITY
100.0/ 100
METRIC RATING
9th/ 347
METRIC RANK
5.7%
AMBULATORY DISABILITY
99.2/ 100
METRIC RATING
80th/ 347
METRIC RANK
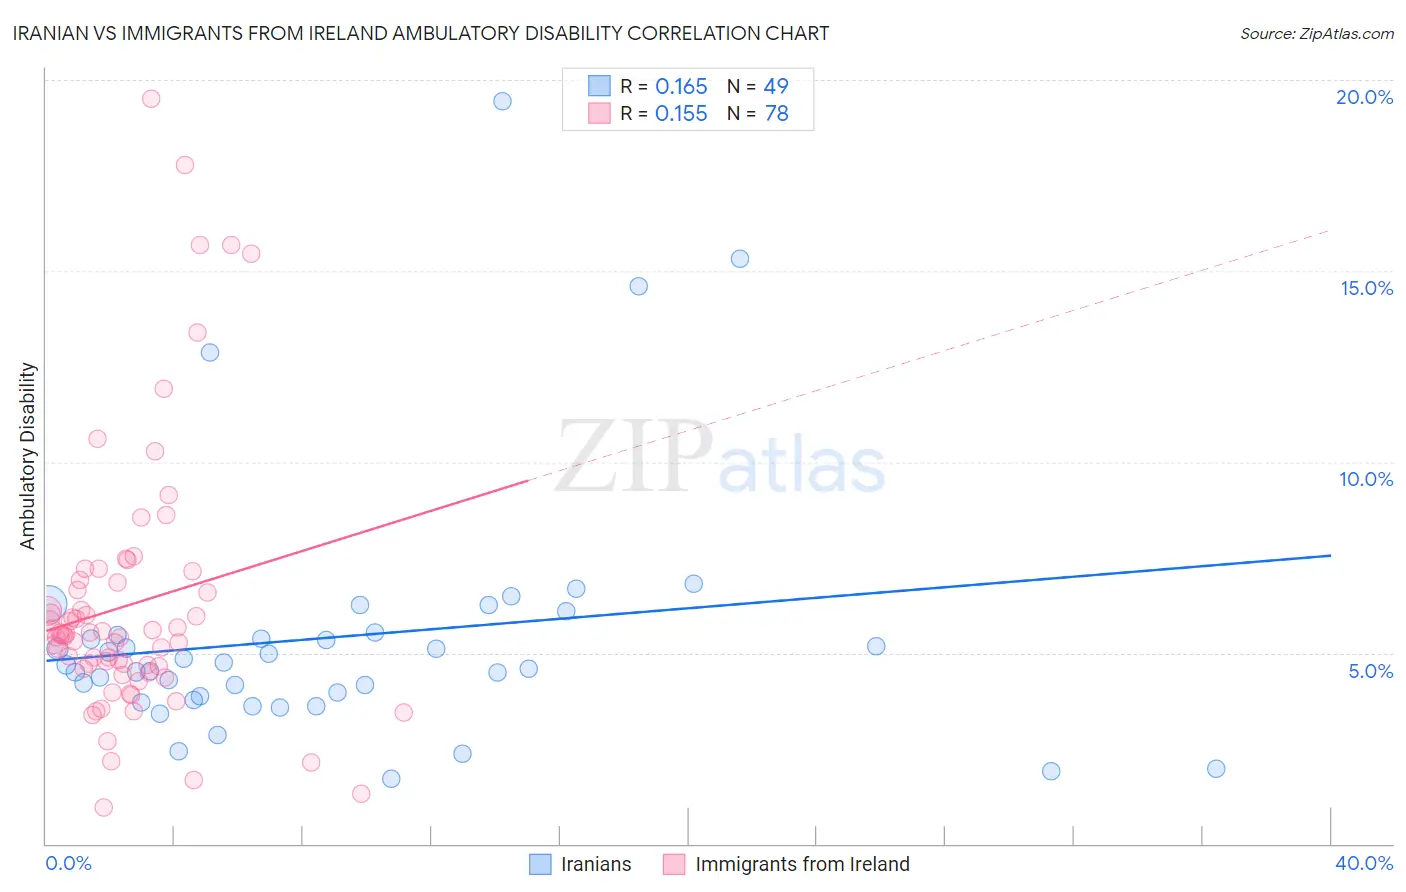
Iranian vs Immigrants from Ireland Ambulatory Disability Correlation Chart
The statistical analysis conducted on geographies consisting of 316,801,609 people shows a poor positive correlation between the proportion of Iranians and percentage of population with ambulatory disability in the United States with a correlation coefficient (R) of 0.165 and weighted average of 5.1%. Similarly, the statistical analysis conducted on geographies consisting of 240,763,505 people shows a poor positive correlation between the proportion of Immigrants from Ireland and percentage of population with ambulatory disability in the United States with a correlation coefficient (R) of 0.155 and weighted average of 5.7%, a difference of 11.8%.
Ambulatory Disability Correlation Summary
| Measurement | Iranian | Immigrants from Ireland |
| Minimum | 1.7% | 0.96% |
| Maximum | 19.5% | 19.5% |
| Range | 17.7% | 18.6% |
| Mean | 5.4% | 6.2% |
| Median | 4.7% | 5.5% |
| Interquartile 25% (IQ1) | 3.8% | 4.6% |
| Interquartile 75% (IQ3) | 5.5% | 6.8% |
| Interquartile Range (IQR) | 1.7% | 2.3% |
| Standard Deviation (Sample) | 3.4% | 3.5% |
| Standard Deviation (Population) | 3.3% | 3.5% |
Similar Demographics by Ambulatory Disability
Demographics Similar to Iranians by Ambulatory Disability
In terms of ambulatory disability, the demographic groups most similar to Iranians are Immigrants from South Central Asia (5.1%, a difference of 0.36%), Yup'ik (5.2%, a difference of 0.60%), Bolivian (5.1%, a difference of 1.4%), Immigrants from Bolivia (5.0%, a difference of 1.7%), and Immigrants from Korea (5.2%, a difference of 2.2%).
| Demographics | Rating | Rank | Ambulatory Disability |
| Filipinos | 100.0 /100 | #2 | Exceptional 4.9% |
| Thais | 100.0 /100 | #3 | Exceptional 4.9% |
| Immigrants | Taiwan | 100.0 /100 | #4 | Exceptional 4.9% |
| Immigrants | Singapore | 100.0 /100 | #5 | Exceptional 5.0% |
| Immigrants | Bolivia | 100.0 /100 | #6 | Exceptional 5.0% |
| Bolivians | 100.0 /100 | #7 | Exceptional 5.1% |
| Immigrants | South Central Asia | 100.0 /100 | #8 | Exceptional 5.1% |
| Iranians | 100.0 /100 | #9 | Exceptional 5.1% |
| Yup'ik | 100.0 /100 | #10 | Exceptional 5.2% |
| Immigrants | Korea | 100.0 /100 | #11 | Exceptional 5.2% |
| Okinawans | 100.0 /100 | #12 | Exceptional 5.3% |
| Burmese | 100.0 /100 | #13 | Exceptional 5.3% |
| Immigrants | Eastern Asia | 100.0 /100 | #14 | Exceptional 5.3% |
| Immigrants | China | 100.0 /100 | #15 | Exceptional 5.3% |
| Immigrants | Hong Kong | 100.0 /100 | #16 | Exceptional 5.3% |
Demographics Similar to Immigrants from Ireland by Ambulatory Disability
In terms of ambulatory disability, the demographic groups most similar to Immigrants from Ireland are Immigrants from Jordan (5.7%, a difference of 0.010%), Palestinian (5.7%, a difference of 0.010%), Eastern European (5.7%, a difference of 0.030%), Ugandan (5.7%, a difference of 0.030%), and Chilean (5.7%, a difference of 0.13%).
| Demographics | Rating | Rank | Ambulatory Disability |
| Immigrants | Northern Africa | 99.4 /100 | #73 | Exceptional 5.7% |
| Immigrants | Cameroon | 99.4 /100 | #74 | Exceptional 5.7% |
| Immigrants | South Africa | 99.3 /100 | #75 | Exceptional 5.7% |
| Sudanese | 99.3 /100 | #76 | Exceptional 5.7% |
| Immigrants | Vietnam | 99.3 /100 | #77 | Exceptional 5.7% |
| Somalis | 99.2 /100 | #78 | Exceptional 5.7% |
| Chileans | 99.2 /100 | #79 | Exceptional 5.7% |
| Immigrants | Ireland | 99.2 /100 | #80 | Exceptional 5.7% |
| Immigrants | Jordan | 99.2 /100 | #81 | Exceptional 5.7% |
| Palestinians | 99.2 /100 | #82 | Exceptional 5.7% |
| Eastern Europeans | 99.2 /100 | #83 | Exceptional 5.7% |
| Ugandans | 99.2 /100 | #84 | Exceptional 5.7% |
| South Americans | 99.0 /100 | #85 | Exceptional 5.7% |
| Latvians | 99.0 /100 | #86 | Exceptional 5.7% |
| Immigrants | Chile | 98.9 /100 | #87 | Exceptional 5.8% |