Inupiat vs Immigrants from South Eastern Asia Ambulatory Disability
COMPARE
Inupiat
Immigrants from South Eastern Asia
Ambulatory Disability
Ambulatory Disability Comparison
Inupiat
Immigrants from South Eastern Asia
5.6%
AMBULATORY DISABILITY
99.8/ 100
METRIC RATING
56th/ 347
METRIC RANK
5.9%
AMBULATORY DISABILITY
93.6/ 100
METRIC RATING
117th/ 347
METRIC RANK
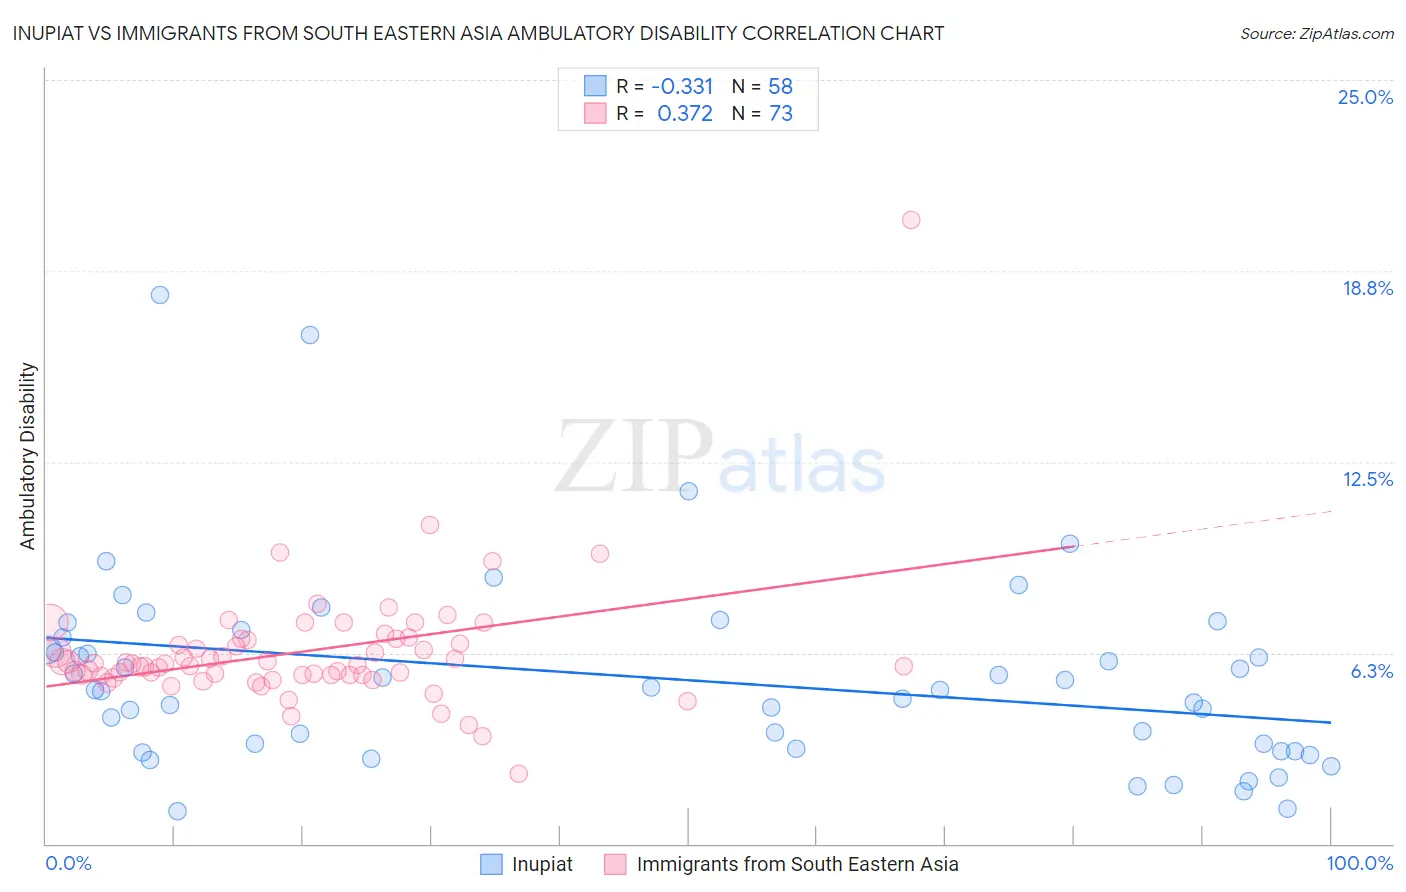
Inupiat vs Immigrants from South Eastern Asia Ambulatory Disability Correlation Chart
The statistical analysis conducted on geographies consisting of 96,327,130 people shows a mild negative correlation between the proportion of Inupiat and percentage of population with ambulatory disability in the United States with a correlation coefficient (R) of -0.331 and weighted average of 5.6%. Similarly, the statistical analysis conducted on geographies consisting of 512,357,808 people shows a mild positive correlation between the proportion of Immigrants from South Eastern Asia and percentage of population with ambulatory disability in the United States with a correlation coefficient (R) of 0.372 and weighted average of 5.9%, a difference of 5.2%.
Ambulatory Disability Correlation Summary
| Measurement | Inupiat | Immigrants from South Eastern Asia |
| Minimum | 1.1% | 2.3% |
| Maximum | 18.0% | 20.4% |
| Range | 16.9% | 18.1% |
| Mean | 5.4% | 6.3% |
| Median | 5.0% | 5.9% |
| Interquartile 25% (IQ1) | 3.1% | 5.5% |
| Interquartile 75% (IQ3) | 6.8% | 6.7% |
| Interquartile Range (IQR) | 3.7% | 1.2% |
| Standard Deviation (Sample) | 3.2% | 2.1% |
| Standard Deviation (Population) | 3.2% | 2.1% |
Similar Demographics by Ambulatory Disability
Demographics Similar to Inupiat by Ambulatory Disability
In terms of ambulatory disability, the demographic groups most similar to Inupiat are Immigrants from Bulgaria (5.6%, a difference of 0.090%), Immigrants from Eastern Africa (5.6%, a difference of 0.16%), Immigrants from Egypt (5.6%, a difference of 0.20%), Jordanian (5.6%, a difference of 0.21%), and Immigrants from Brazil (5.6%, a difference of 0.24%).
| Demographics | Rating | Rank | Ambulatory Disability |
| Bulgarians | 99.9 /100 | #49 | Exceptional 5.6% |
| Luxembourgers | 99.9 /100 | #50 | Exceptional 5.6% |
| Taiwanese | 99.8 /100 | #51 | Exceptional 5.6% |
| Jordanians | 99.8 /100 | #52 | Exceptional 5.6% |
| Immigrants | Egypt | 99.8 /100 | #53 | Exceptional 5.6% |
| Immigrants | Eastern Africa | 99.8 /100 | #54 | Exceptional 5.6% |
| Immigrants | Bulgaria | 99.8 /100 | #55 | Exceptional 5.6% |
| Inupiat | 99.8 /100 | #56 | Exceptional 5.6% |
| Immigrants | Brazil | 99.8 /100 | #57 | Exceptional 5.6% |
| Immigrants | Zimbabwe | 99.8 /100 | #58 | Exceptional 5.6% |
| Immigrants | Afghanistan | 99.8 /100 | #59 | Exceptional 5.6% |
| Immigrants | Lithuania | 99.8 /100 | #60 | Exceptional 5.6% |
| Immigrants | Belgium | 99.7 /100 | #61 | Exceptional 5.6% |
| Immigrants | Spain | 99.7 /100 | #62 | Exceptional 5.6% |
| Immigrants | France | 99.7 /100 | #63 | Exceptional 5.6% |
Demographics Similar to Immigrants from South Eastern Asia by Ambulatory Disability
In terms of ambulatory disability, the demographic groups most similar to Immigrants from South Eastern Asia are Russian (5.9%, a difference of 0.040%), Norwegian (5.9%, a difference of 0.11%), Estonian (5.9%, a difference of 0.15%), Costa Rican (5.9%, a difference of 0.22%), and Icelander (5.9%, a difference of 0.22%).
| Demographics | Rating | Rank | Ambulatory Disability |
| Immigrants | Colombia | 96.7 /100 | #110 | Exceptional 5.8% |
| Danes | 96.6 /100 | #111 | Exceptional 5.8% |
| South Africans | 96.3 /100 | #112 | Exceptional 5.9% |
| Immigrants | Uruguay | 95.6 /100 | #113 | Exceptional 5.9% |
| Immigrants | Poland | 95.4 /100 | #114 | Exceptional 5.9% |
| South American Indians | 94.8 /100 | #115 | Exceptional 5.9% |
| Immigrants | Africa | 94.7 /100 | #116 | Exceptional 5.9% |
| Immigrants | South Eastern Asia | 93.6 /100 | #117 | Exceptional 5.9% |
| Russians | 93.4 /100 | #118 | Exceptional 5.9% |
| Norwegians | 93.1 /100 | #119 | Exceptional 5.9% |
| Estonians | 92.9 /100 | #120 | Exceptional 5.9% |
| Costa Ricans | 92.6 /100 | #121 | Exceptional 5.9% |
| Icelanders | 92.6 /100 | #122 | Exceptional 5.9% |
| Immigrants | Russia | 92.4 /100 | #123 | Exceptional 5.9% |
| Immigrants | Middle Africa | 92.2 /100 | #124 | Exceptional 5.9% |